
|
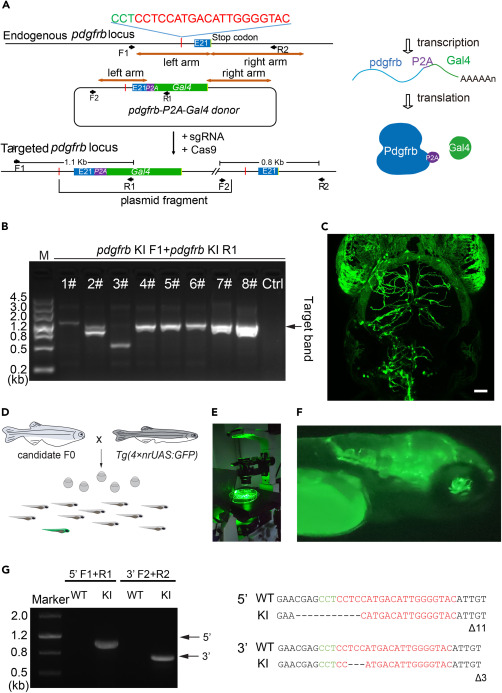
Fig. 4 Generation of the Ki(pdgfrb-P2A-Gal4-VP16) line by CRISPR-Cas9 mediated knockin (A) Schematic representation of CRISPR-Cas9 mediated knockin of Gal4-VP16 into the endogenous gene locus of pdgfrb. Cite from Zi et al.1 (B) Gel electrophoresis results assessing the efficiency of knockin of Gal4 into pdgfrb in injected F0 larvae. The primers pdgfrb KI F1/ pdgfrb KI R1 are used for PCR test. M represents the marker. Lanes 1#∼#5, mixture of 10 injected Nacre larvae for each sample; Lanes 6#∼8#, individual injected Tg(UAS:EGFP) larvae exhibiting fluorescent labeling; Lane 7# and Lane 8#, the larvae with extensive fluorescent labeling of brain pericytes; Lane 8 # is shown in (C) as a typical case; Un-injected control larvae (Ctrl) are used for test. The sizes for the ladder of marker are labeled in the left, and the size of target band is marked with arrow in the right. (C) Representative image of pericytes in the brain of the 6.5-dpf Tg(UAS:EGFP) larvae that injected for Ki(pdgfrb-P2A-Gal4-VP16). Imaging was performed with a FV3000 confocal microscope according to the methods described in Step 15. The image is processed with the software ImageJ. Pericyte in green. Scale bar 50 μm. (D) Schematic outlining the screening process for founders by out-crossing, the green represent a GFP positive Ki(pdgfrb-P2A-Gal4-VP16);Tg(4×nrUAS:GFP) larva. (E) Photograph of a fluorescence-capable stereo microscope for fluorescence used to identify the fluorescent signals in the candidate larvae. (F) Representative images of Ki(pdgfrb-P2A-Gal4-VP16);Tg(4×nrUAS:GFP) larvae under the stereo microscope for fluorescence. (G) PCR and sequencing for confirming the knockin of Gal4-VP16 into endogenous pdgfrb locus. The primers pdgfrb KI F1, pdgfrb KI R1,pdgfrb KI F2, pdgfrb KI R2 are used for PCR. The target band for 5′ junction and 3′ junction are marked with arrows. The primer pdgfrb KI F1 is used for sequencing the target band of 5′ junction, and the primer pdgfrb KI F2 is used for sequencing the target band of 3′ junction. The sgRNA binding site is labeled in red, PAM area in green. Cite from Zi et al.1.