
- Title
-
Spring viremia of carp virus infection induces hypoxia response in zebrafish by stabilizing hif1α
- Authors
- Wang, Z., Zhu, C., Sun, X., Deng, H., Liu, W., Jia, S., Bai, Y., Xiao, W., Liu, X.
- Source
- Full text @ J. Virol.
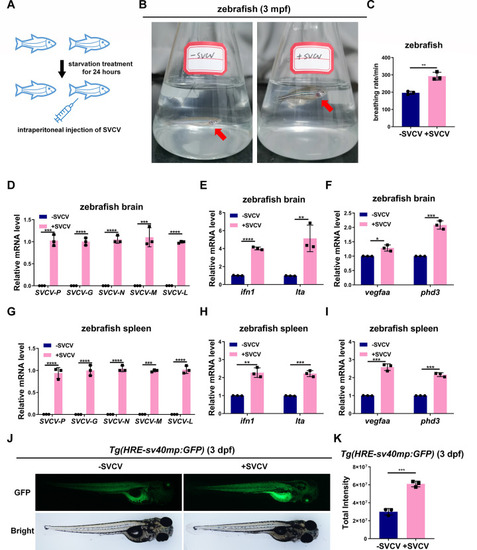
SVCV infection causes hypoxia-induced symptoms and promotes hypoxia-inducible gene expression in zebrafish. ( |
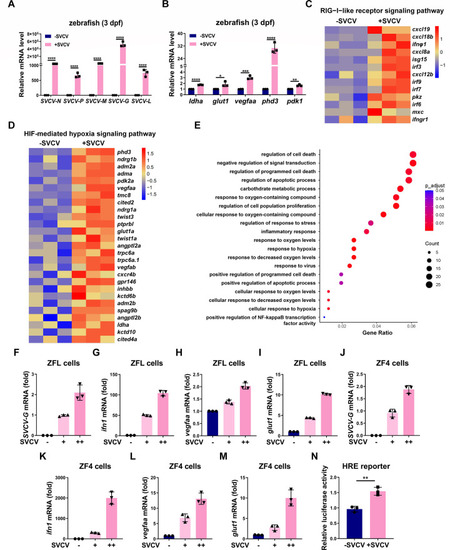
SVCV infection enhances hypoxia signaling in zebrafish and zebrafish cells. ( |
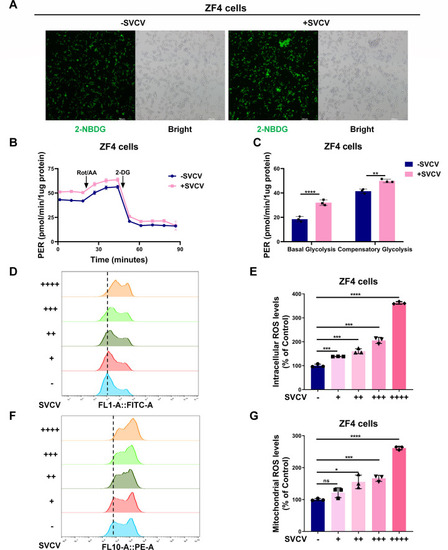
SVCV infection enhances glucose uptake, glycolytic rate, and intracellular and mitochondrial ROS levels in ZF4 cells. ( |
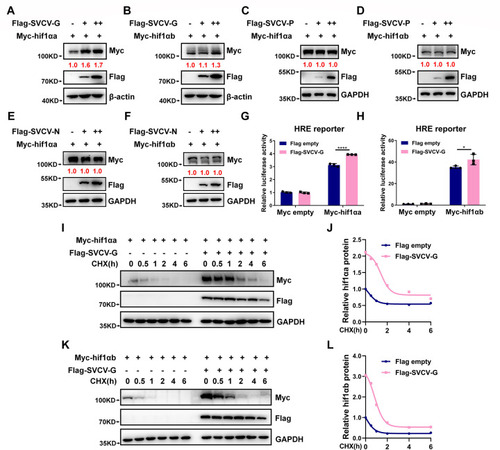
SVCV-G protein stabilizes hif1αa and hif1αb. ( |
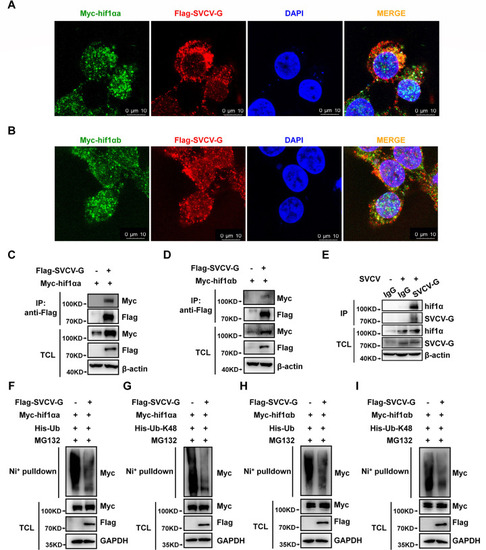
SVCV-G protein interacts with hif1αa and hif1αb to attenuate K48-linked polyubiquitination of hif1αa and hif1αb. ( |
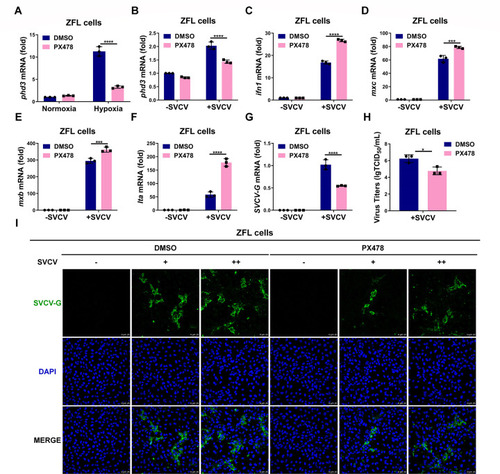
HIF-1α inhibitor PX478 enhances the antiviral ability against SVCV infection and inhibits SVCV replication in ZFL cells. ( |
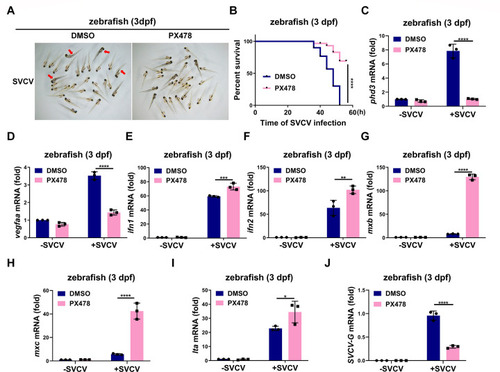
HIF-1α inhibitor PX478 enhances the antiviral ability against SVCV infection and inhibits SVCV replication in zebrafish. ( |