IMAGE

Fig 4

ID
ZDB-IMAGE-250203-12
Source
Figures for Wang et al., 2024
Image
Figure Caption

Fig 4

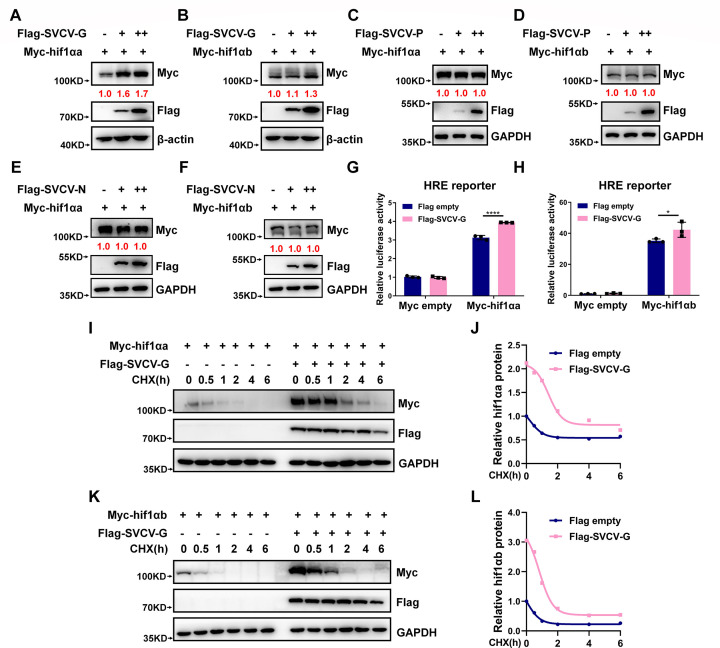
SVCV-G protein stabilizes hif1αa and hif1αb. (A, B) Immunoblotting (IB) of Myc-hif1αa (A) and Myc-hif1αb (B) in HEK293T cells transfected with the plasmid expressing Myc-hif1αa or Myc-hif1αb together with increasing amounts of Flag-SVCV-G (Flag empty vector [-] was used as a control). (C, D) IB of Myc-hif1αa (C) and Myc-hif1αb (D) in HEK293T cells transfected with the plasmid expressing Myc-hif1αa or Myc-hif1αb together with increasing amounts of Flag-SVCV-P (Flag empty vector [-] was used as a control). (E, F) IB of Myc-hif1αa (E) and Myc-hif1αb (F) in HEK293T cells transfected with the plasmid expressing Myc-hif1αa or Myc-hif1αb together with increasing amounts of Flag-SVCV-N (Flag empty vector [-] was used as a control). (G, H) HRE reporter activity in HEK293T cells transfected with the plasmid expressing Myc-hif1αa (G) or Myc-hif1αb (H) together with Flag-SVCV-G (Flag empty vector was used as a control). (I, J) IB of the indicated proteins in HEK293T cells transfected with Myc-hif1αa together with Flag-SVCV-G for 24 h (Flag empty vector [-] was used as a control) and then treated with cycloheximide (CHX, 50 µg/mL) for an increasing time (0–6 h) (I). The relative intensities of Myc-hif1αa were determined by normalizing the intensities of Myc-hif1αa to the intensities of GAPDH (J). (K, L) IB of the indicated proteins in 293T cells transfected with Myc-hif1αb together with Flag-SVCV-G for 24 h (Flag empty vector [-] was used as a control) and then treated with CHX (50 µg/mL) for an increasing time (0–6 h) (K). The relative intensities of Myc-hif1αb were determined by normalizing the intensities of Myc-hif1αb to the intensities of GAPDH (L).

Acknowledgments
This image is the copyrighted work of the attributed author or publisher, and ZFIN has permission only to display this image to its users. Additional permissions should be obtained from the applicable author or publisher of the image. Full text @ J. Virol.