
- Title
-
Aurora kinase B is required for growth and expansion of medulloblastoma cells in the tissue context
- Authors
- Gries, A., Santhana Kumar, K., Kuttler, F., Özalp, Ö., Akle, V., Zhang, H., Grotzer, M.A., Neuhauss, S.C.F., Allalou, A., Baumgartner, M.
- Source
- Full text @ Neoplasia
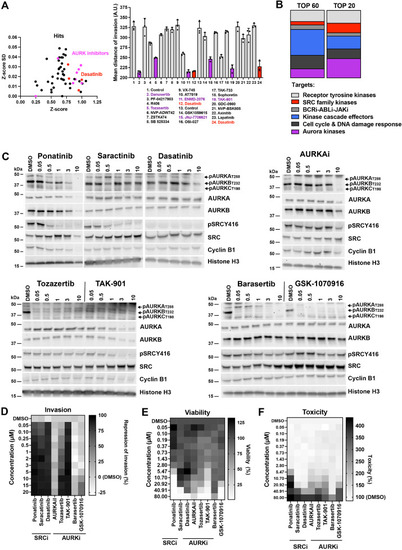
Blockade of collagen I invasion by Aurora and BCR-ABL/SRC kinase inhibitors. A) Left: X/Y plot of Z-score and Z-score SD of hit list. Right: Validation of selected drugs using SIA and aCDc software[14] showing mean distances of invasion from center of spheroids and SD (n=3 biological replicas). Purple: AURKBi, red: BCR-ABL/SRC inhibitors, all tested at 3 µM. B) Representation of top 60 and top 20 candidates across kinase inhibitor families. C) IB using antibodies specific for the phosphorylation of the active sites of SRC, and aurora kinase A and B proteins. Cyclin B1 protein expression confirms cell proliferation. D) Heat-map of mean values of anti-invasion efficacy of selected kinase inhibitors of SIA shown in A). E) Heat-map of mean cell viability in ONS-76 cells. F) Heat-map of cytotoxicity in ONS-76 cells. (D – E: n=3 biological replicas). |
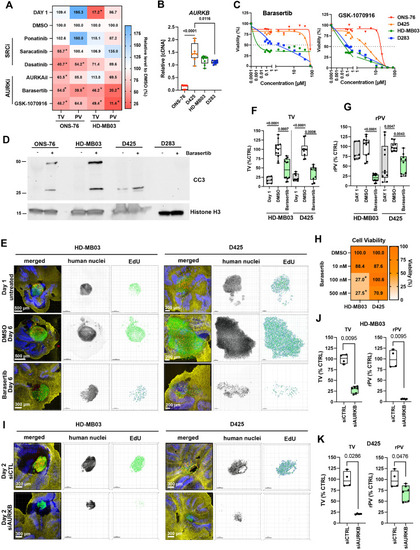
AURKBi reduces medulloblastoma cell dissemination ex vivo. A) Heat-map of tumor volume (TV) and relative proliferation volume (rPV = PV/TV) of ONS-76 and HD-MB03 cells in OCSCs after 5 days of treatment (* p0.0338). B) RT-qPCR analysis of AURKB expression (n=3 biological replicas). C) Relative cell viability in response to Barasertib and GSK-1070916 (n=3 biological replicas). D) IB analyses of anti-cleaved caspase 3 (CC3) and anti-histone H3 of cells treated with 0.05 (HD-MB03) or 3 (ONS-76, D425, D283) µM Barasertib. E) Confocal microscopy IFA of OCSCs with implanted HD-MB03 and D425 cells (green). OCSCs with implanted tumor cells were treated with Barasertib at either 500 nM (HD-MB03) or 100 nM (D425) concentrations. Red: Click-iT® EdU, blue: anti-calbindin, and yellow: anti-GFAP. Human nuclei are displayed in inverted greyscale and EdU incorporation as volume renderings from Z-stack images. F) TV of n=5 individually implanted spheroids. G) rPV of n=5 individually implanted spheroids. H) Heat map of in vitro cell viability of HD-MB03 and D425 cells after 5-days of treatments (n=3 biological replicas, *p 0.0018). I) Confocal microscopy IFA of OCSCs with implanted HD-MB03 and D425 cells (green) with siRNA-mediated depletion of AURKB in tumor cells. Human nuclei are displayed in inverted greyscale and EdU incorporation as volume renderings from Z-stack images. J) TV and rPV of HD-MB03 of experiment shown in I. Data of n=3 individually implanted spheroids are shown. K) TV rPV of D425 of experiment shown in I. Data of n=3 individually implanted spheroids are shown. |
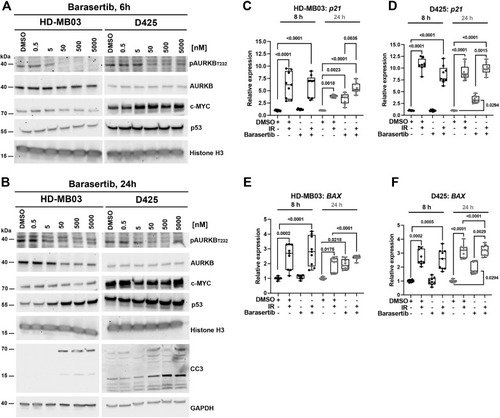
AURKBi induces p53 expression and cleaved caspase 3 in Grp 3 MB. A) IB of Barasertib treatment effects on AURKA,B,C phosphorylation (pThr232) and MYC and p53 protein levels after 6 h of treatment. B) IB of Barasertib treatment effects on AURKA,B,C phosphorylation and MYC, p53 protein levels and CC3 after 24 h of treatment. C-F) RT-qPCR quantifications of p21 and BAX mRNA levels in HD-MB03 (C,E) and D425 (D,F) cells. Cells were irradiated (IR, 1,8 Gy) and/or treated with Barasertib (50 nM) for 8 and 24 h (n=3 biological replicas). |
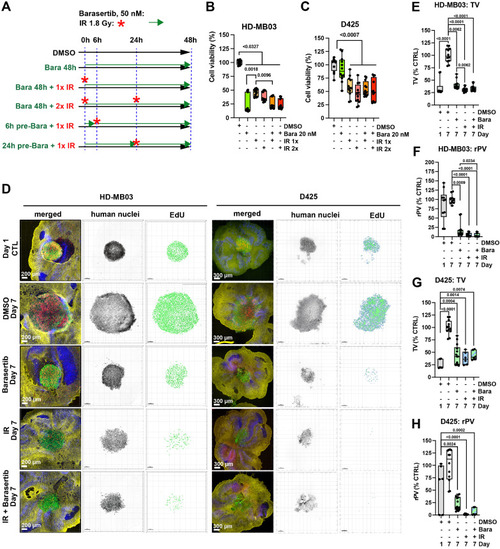
AURKBi and IR display comparable tumor suppressive activity in vitro and ex vivo. A) Experimental procedure for the in vitro cell viability assays shown in B and C. B) Viability of HD-MB03 and C) D425 cells in response to IR (1,8 Gy) and Barasertib (20 nM) treatment alone or in combination after 48 h (n=3 biological replicas). D) Confocal microscopy IFA of OCSCs 6 days after treatments with Barasertib 100 nM and IR 1.8 Gy. Green: Anti-human nucleoli antibody, red: Click-iT® EdU, blue: anti-Cabindin Click-iT® EdU, yellow: anti-GFAP. Human nuclei are displayed in inverted grey scale and EdU incorporation as volume renderings from Z-stack images. E-H) Box plots of TV and rPV of OCSCs from D. (n≥3 biological replicas). |
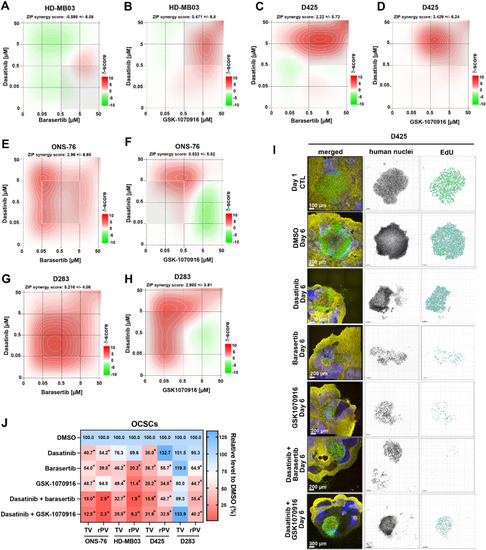
Synergistic activity of AURKBi and Dasatinib in vitro and ex vivo. A-H) Synergy scores of drug combinations after 48 h of treatment with 0.005, 0.05, 0.5, 5 and 50 µM of Barasertib and Dasatinib in HD-MB03 (A), D425 (C), ONS-76 (E) and in D283 (G) cells. Synergy score of drug combination of GSK-1070916 and Dasatinib in HD-MB03 (B), D425 (D), ONS-76 (F) and in D283 (H) cells. I) Confocal microscopy IFA of OCSC-embedded D425 cells treated for 5 days with 100 nM Barasertib, GSK-1070916, or Dasatinib, and combinations of Barasertib and Dasatinib or GSK-1070916 and Dasatinib. Green: Anti-human nucleoli antibody, red: Click-iT® EdU, blue: anti-Cabindin, yellow: anti-GFAP. Human nuclei are displayed in inverted grey scale and EdU incorporation as volume renderings from Z-stack images. J) Heat map of TV and rPV of ONS-76, HD-MB03, D425 and D283 OCSC co-cultures after 5-days of treatments (n≥3 biological replicas, *p 0.0338). |
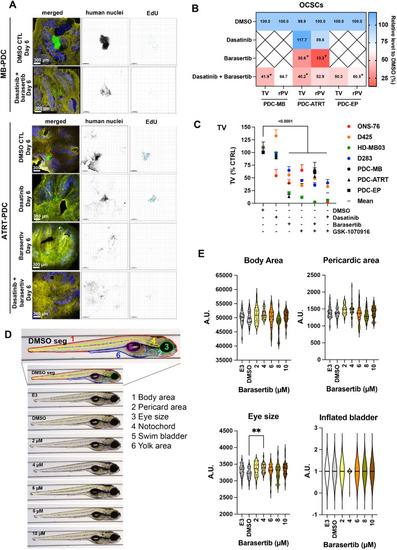
Barasertib effectively blocks patient-derived cell growth in the tissue context as is not toxic. Confocal microscopy IFA of OCSC implanted MB-PDC and ATART-PDC 5 days after treatments with 500 nM Barasertib or Dasatinib or the combination of Barasertib and Dasatinib. Green: Anti-human nucleoli antibody (PDCs), red: Click-iT® EdU, blue: anti-Cabindin, yellow: anti-GFAP. MB: medulloblastoma, ATRT: atypical teratoid rhabdoid tumor, EP: ependymoma. Human nuclei are displayed in inverted greyscale and EdU incorporation as volume renderings from Z-stacks. B) Heat map of TV and rPV of PDC-OCSC co-cultures after 5-days of treatments (n≥3 biological replicas, *p 0.05). C-D) TV and the rPV of all cell lines and PDCs used (Mean + SEM). C) Compilation of all TVs from the OCSC experiments. D) Representative VAST images of lateral view of zebrafish in the different treatment groups. The first image corresponds to a control animal with segmentation of anatomical regions studied: body area (red), eye size (green), pericardiac area (light blue), inflated bladder (pink), yolk area (blue), and notochord (yellow). E) Quantification of a subset of morphological areas shown in D. |