
|
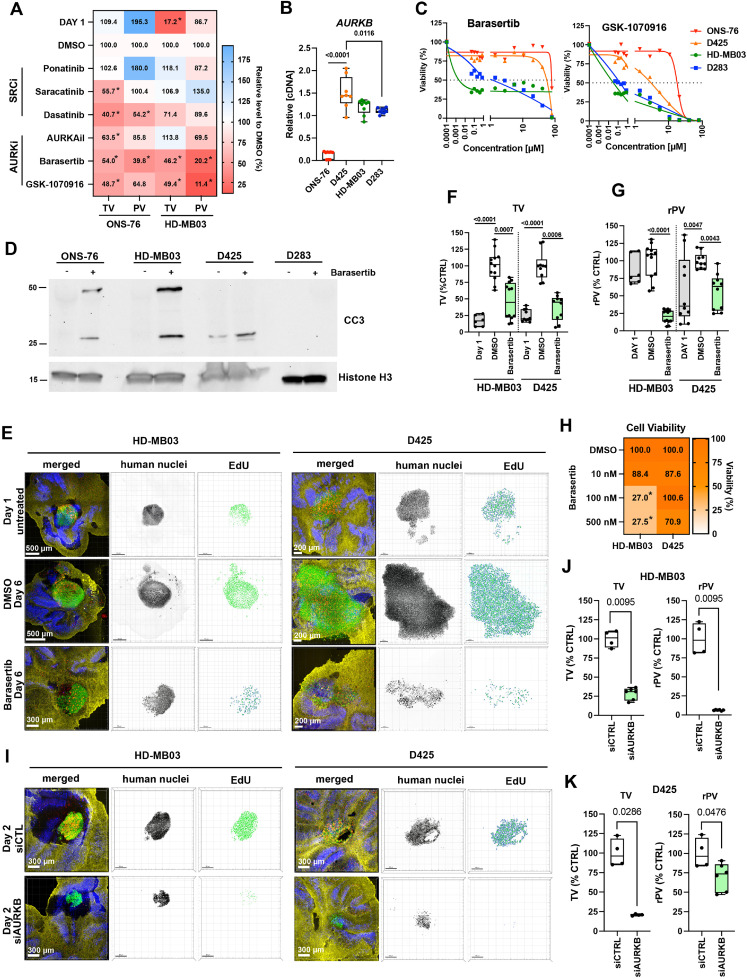
Fig. 2 AURKBi reduces medulloblastoma cell dissemination ex vivo. A) Heat-map of tumor volume (TV) and relative proliferation volume (rPV = PV/TV) of ONS-76 and HD-MB03 cells in OCSCs after 5 days of treatment (* p0.0338). B) RT-qPCR analysis of AURKB expression (n=3 biological replicas). C) Relative cell viability in response to Barasertib and GSK-1070916 (n=3 biological replicas). D) IB analyses of anti-cleaved caspase 3 (CC3) and anti-histone H3 of cells treated with 0.05 (HD-MB03) or 3 (ONS-76, D425, D283) µM Barasertib. E) Confocal microscopy IFA of OCSCs with implanted HD-MB03 and D425 cells (green). OCSCs with implanted tumor cells were treated with Barasertib at either 500 nM (HD-MB03) or 100 nM (D425) concentrations. Red: Click-iT® EdU, blue: anti-calbindin, and yellow: anti-GFAP. Human nuclei are displayed in inverted greyscale and EdU incorporation as volume renderings from Z-stack images. F) TV of n=5 individually implanted spheroids. G) rPV of n=5 individually implanted spheroids. H) Heat map of in vitro cell viability of HD-MB03 and D425 cells after 5-days of treatments (n=3 biological replicas, *p 0.0018). I) Confocal microscopy IFA of OCSCs with implanted HD-MB03 and D425 cells (green) with siRNA-mediated depletion of AURKB in tumor cells. Human nuclei are displayed in inverted greyscale and EdU incorporation as volume renderings from Z-stack images. J) TV and rPV of HD-MB03 of experiment shown in I. Data of n=3 individually implanted spheroids are shown. K) TV rPV of D425 of experiment shown in I. Data of n=3 individually implanted spheroids are shown.