
- Title
-
Candidate Gene Expression in Adult Zebrafish Models of Type 2 Diabetes Mellitus
- Authors
- Shezi, M., Snyman, C., Niesler, C.U.
- Source
- Full text @ Zebrafish
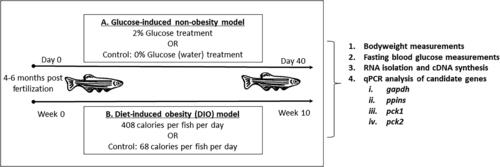
Experimental approach to establishing type 2 diabetes mellitus (T2DM) zebrafish models. Adult zebrafish [4–6 months postfertilization (pf), males and females] were (A) continuously exposed to a 0% (control group) or 2% (experimental group) glucose solution for 40 days or (B) fed 68 calories (control group) or 408 calories (experimental group) of Otohime per fish per day for 10 weeks. Bodyweight, fasting blood glucose measurements, and RNA isolation were performed on all carcasses following euthanasia. mRNA was transcribed to cDNA and used for quantitative polymerase chain reaction (qPCR) analysis. |
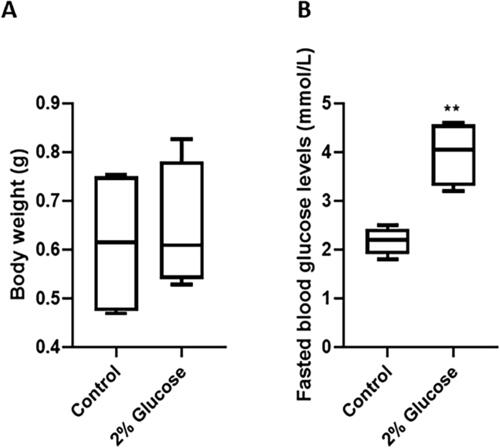
Bodyweight and fasting blood glucose levels of control and glucose-exposed zebrafish. Adult zebrafish were continuously exposed to 2% glucose solution or tank water (control) for 40 days. At day 40, the control group (n = 6) and experimental group (n = 7) were weighed (A), and fasting blood glucose levels measured (B). Data were analyzed using Student’s t-test; values are mean ± standard deviation (SD) vs. control; **p < 0.01. |
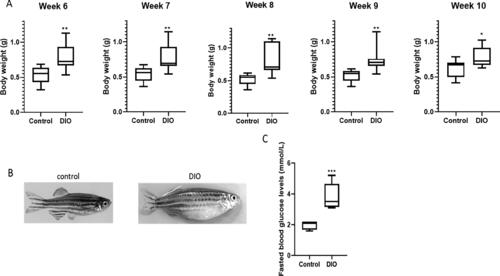
Bodyweight change and fasting blood glucose of control and overfed [diet-induced obesity (DIO)] zebrafish. Adult zebrafish were overfed (DIO; 408 calories per fish per day; n = 7) or normal fed (control; 68 calories per fish per day, n = 6) for 10 weeks. The control and overfed groups were weighed weekly during the period of treatment (A); a visual difference in bodyweight was observed (B); and fasting blood glucose was measured (C) at week 10. Data were analyzed using the Student’s t-test; values are mean ± SD against control; *p < 0.05, **p < 0.01, ***p < 0.005. |
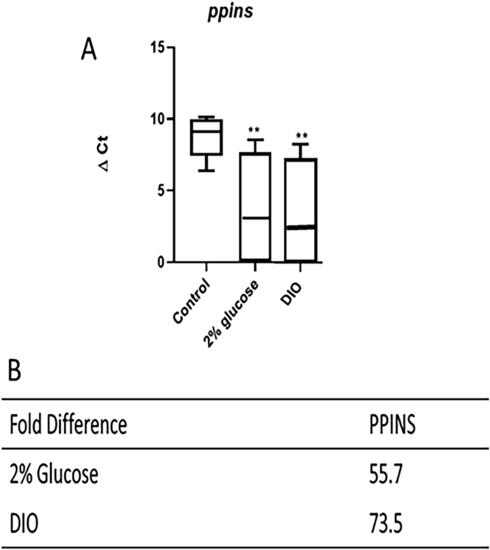
ΔCt values and fold-change in gene expression of preproinsulin essential in both adult zebrafish models of diabetes. qPCR analysis of zebrafish preproinsulin (ppins) (A) in control vs. the 2% glucose-induced nonobesity model and the DIO model. ΔCt values were taken as a mean of the population (n = 6 and n = 7 for control and experimental groups, respectively), and a fold-change was determined for each candidate gene (B). Data were analyzed using one-way analysis of variance (ANOVA); β-actin is the reference gene; values are mean ± SD vs. control; **p < 0.01. |
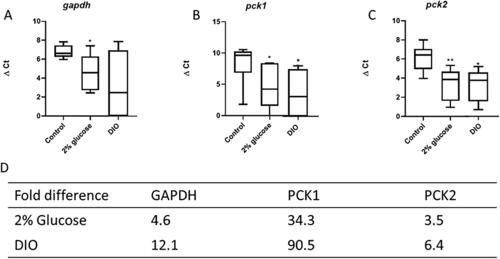
ΔCt values and fold-change in gene expression of enzymes essential for glucose metabolism in both adult zebrafish models of diabetes. qPCR analysis of zebrafish GAPDH (gapdh) (A) and phosphoenolpyruvate carboxykinase 1 and 2 (pck1 and pck2) (B and C, respectively) in control vs. the 2% glucose-induced nonobesity model and the DIO model. ΔCt values were plotted to indicate the mean of the population; n = 6 and n = 7 for control and experimental groups, respectively, for each gene; the ΔCt values were used to determine fold changes (D). Data were analyzed using one-way ANOVA; β-actin is the reference gene; values are mean ± SD vs. control; *p < 0.05, **p < 0.01. |