
Image
|
Figure Caption
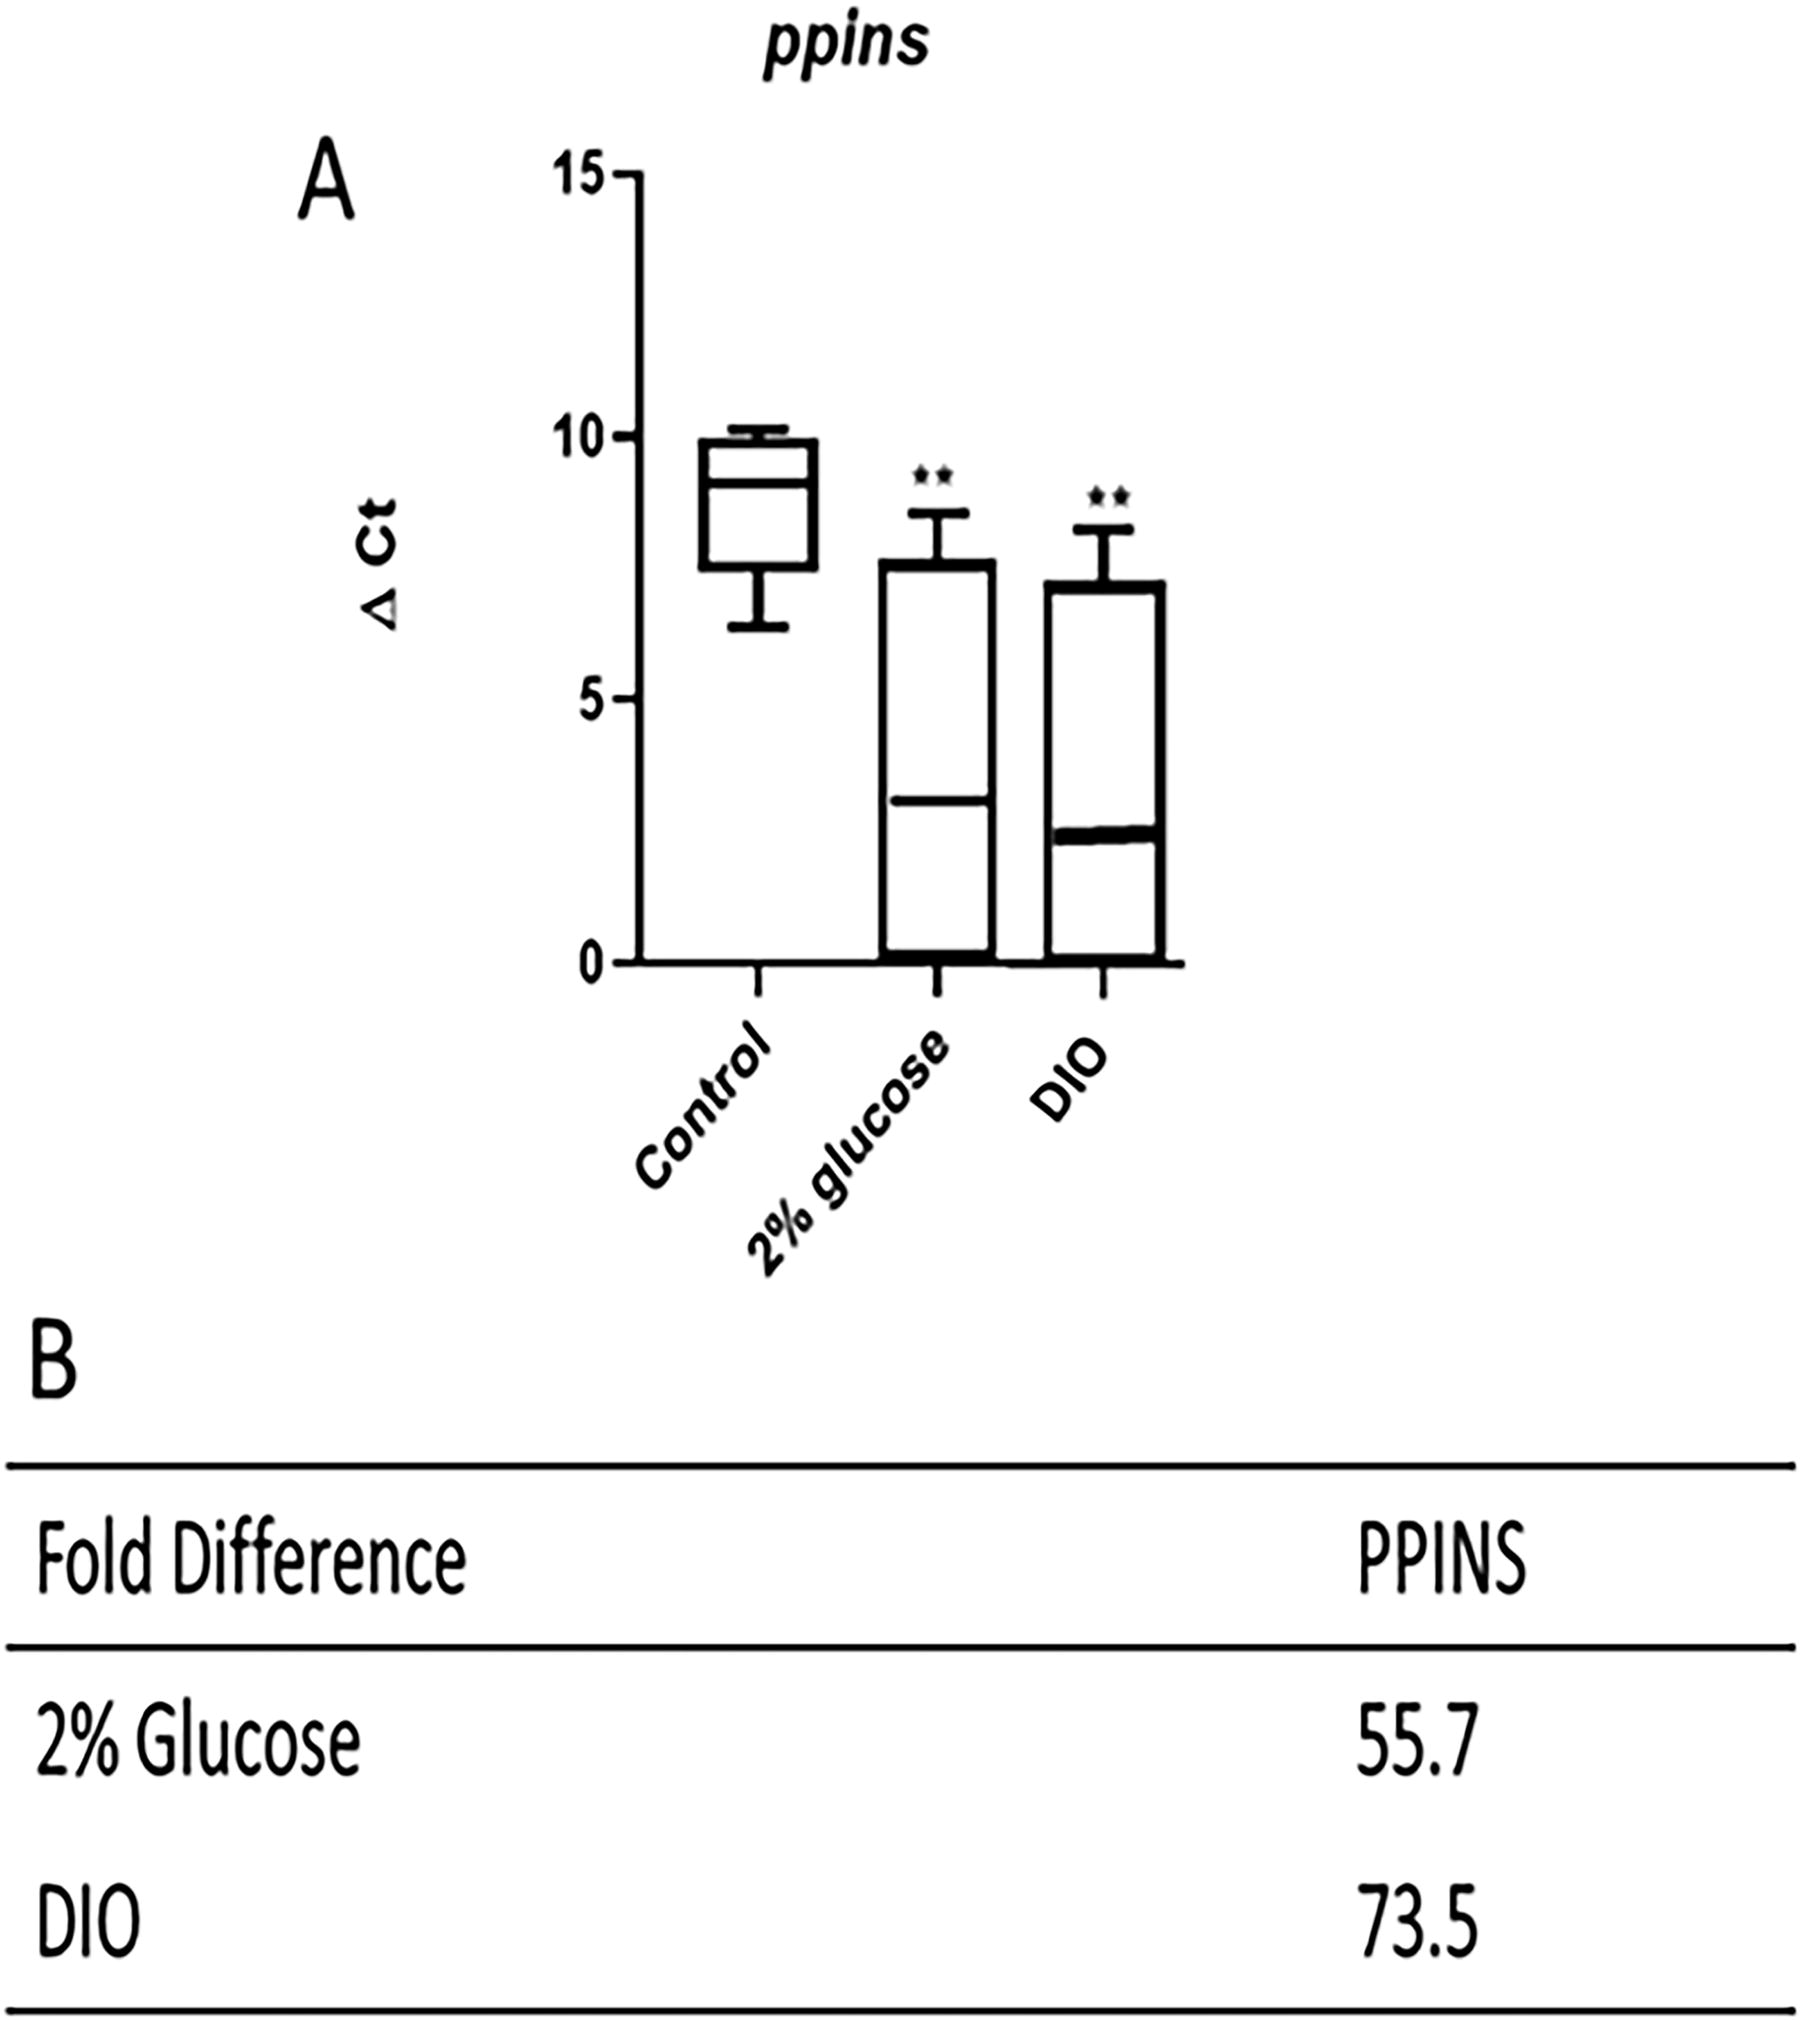
Fig. 4 ΔCt values and fold-change in gene expression of preproinsulin essential in both adult zebrafish models of diabetes. qPCR analysis of zebrafish preproinsulin (ppins) (A) in control vs. the 2% glucose-induced nonobesity model and the DIO model. ΔCt values were taken as a mean of the population (n = 6 and n = 7 for control and experimental groups, respectively), and a fold-change was determined for each candidate gene (B). Data were analyzed using one-way analysis of variance (ANOVA); β-actin is the reference gene; values are mean ± SD vs. control; **p < 0.01.
Acknowledgments
This image is the copyrighted work of the attributed author or publisher, and
ZFIN has permission only to display this image to its users.
Additional permissions should be obtained from the applicable author or publisher of the image.
Full text @ Zebrafish