
|
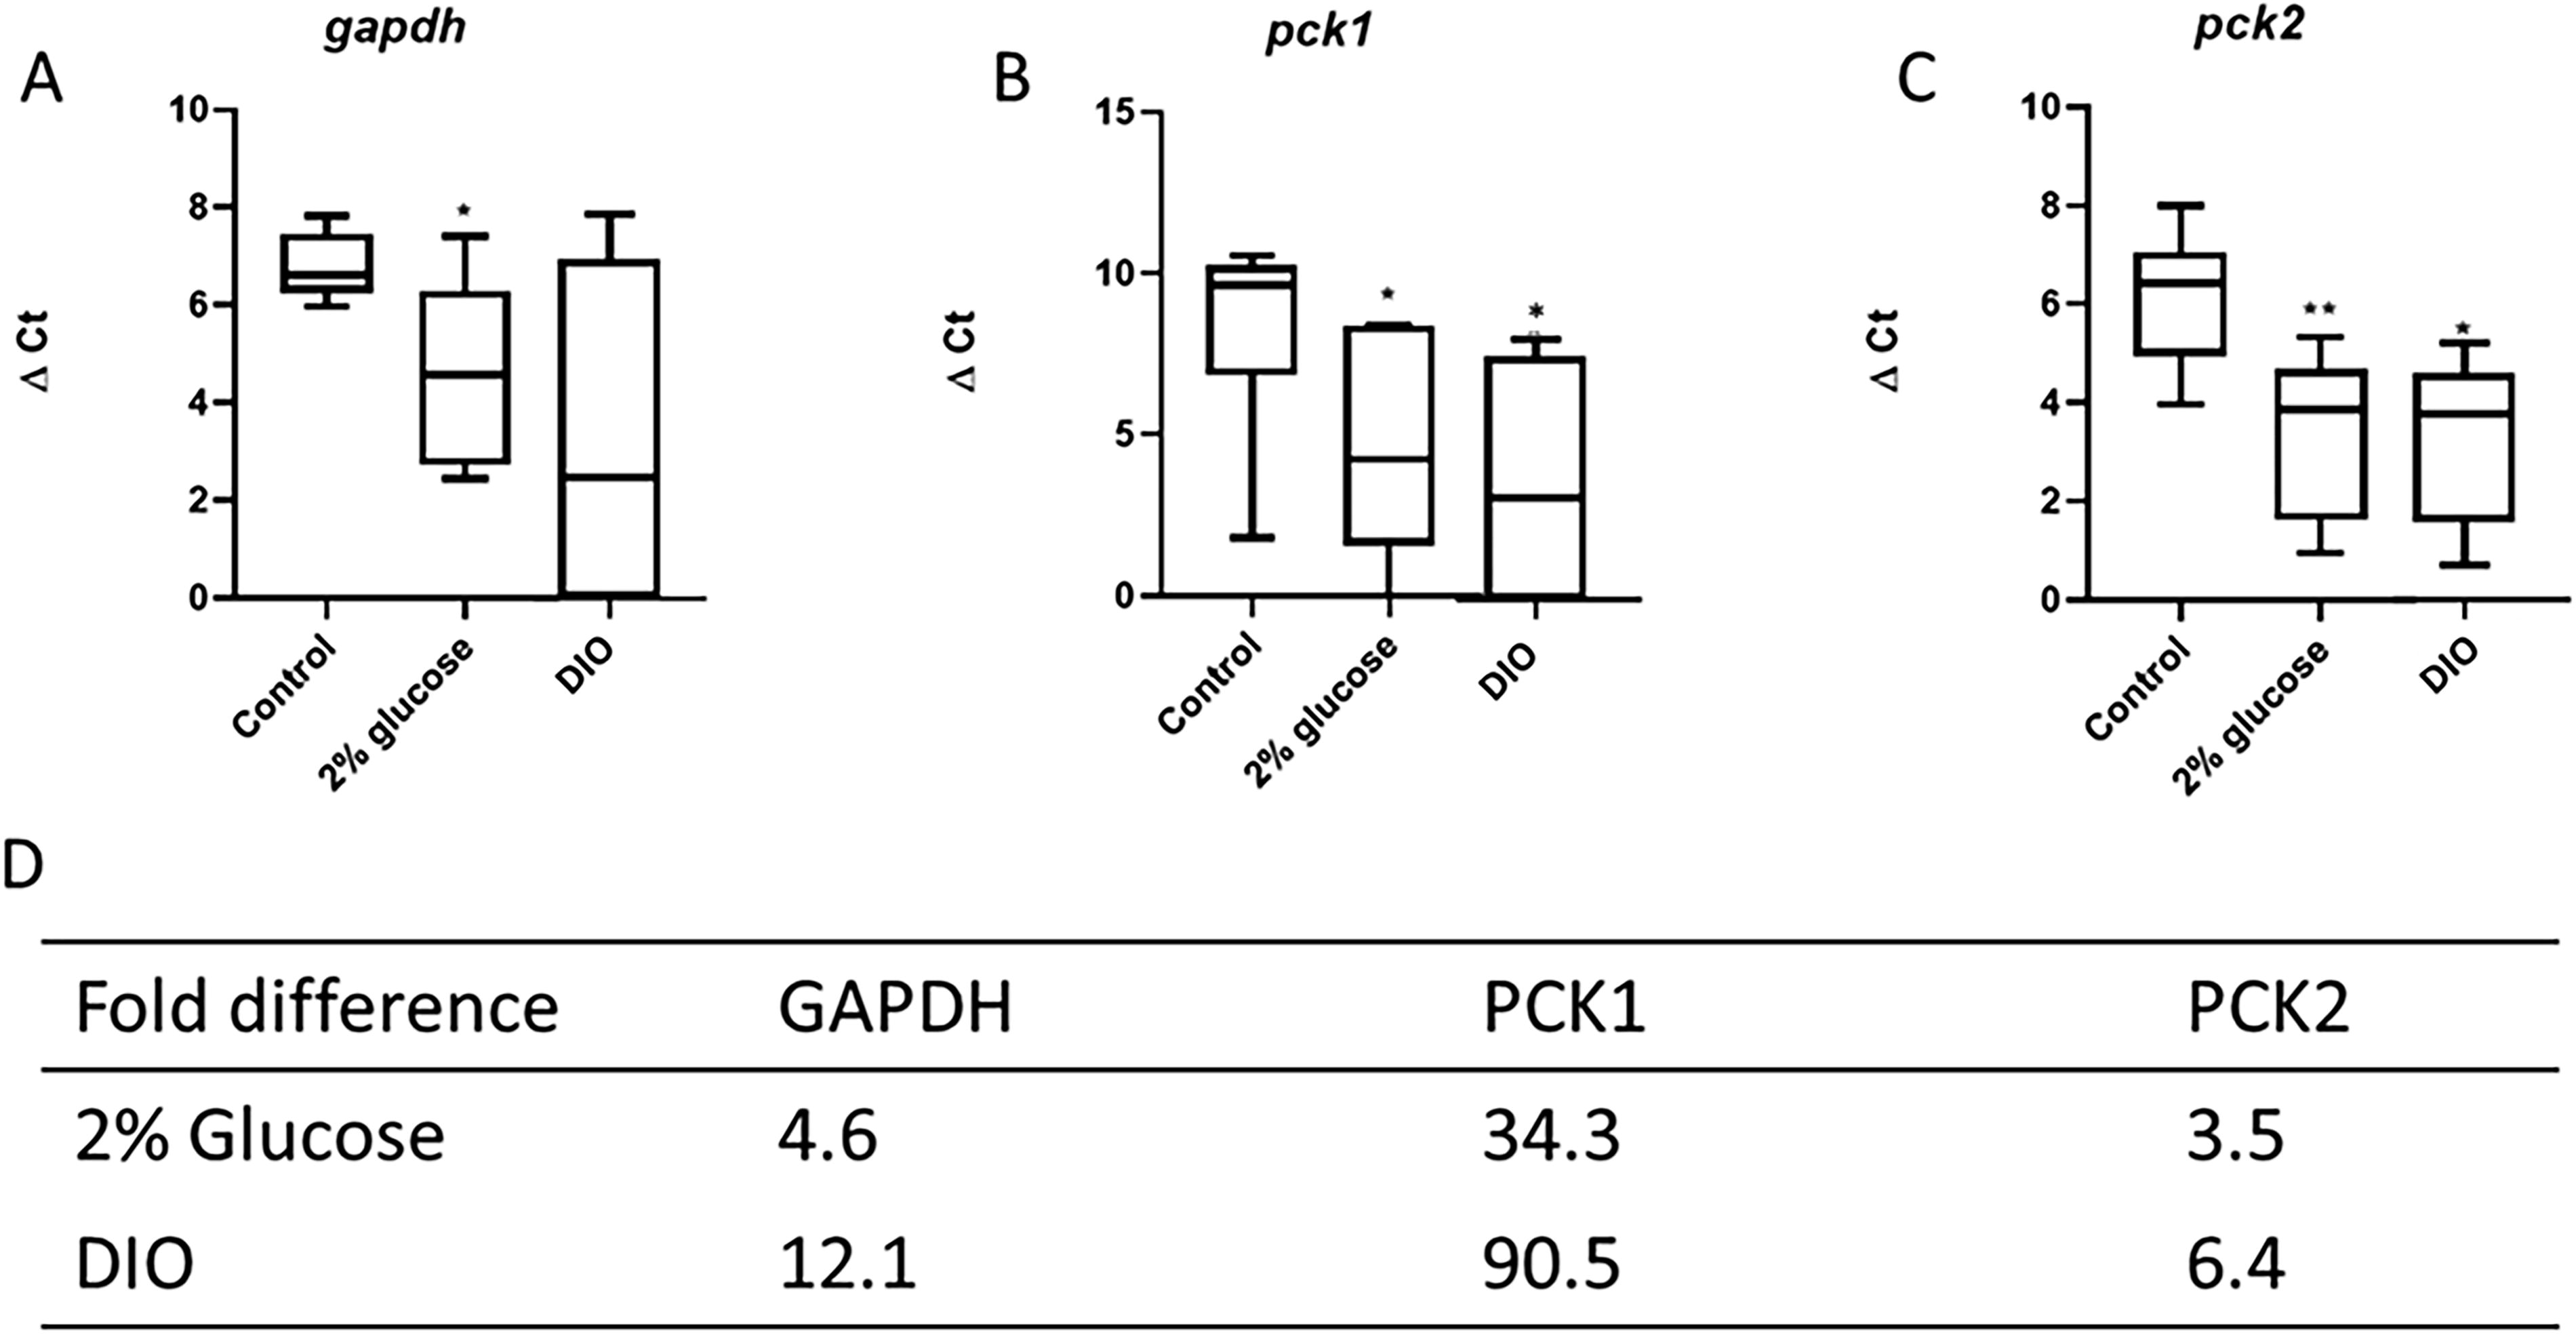
Fig. 5 ΔCt values and fold-change in gene expression of enzymes essential for glucose metabolism in both adult zebrafish models of diabetes. qPCR analysis of zebrafish GAPDH (gapdh) (A) and phosphoenolpyruvate carboxykinase 1 and 2 (pck1 and pck2) (B and C, respectively) in control vs. the 2% glucose-induced nonobesity model and the DIO model. ΔCt values were plotted to indicate the mean of the population; n = 6 and n = 7 for control and experimental groups, respectively, for each gene; the ΔCt values were used to determine fold changes (D). Data were analyzed using one-way ANOVA; β-actin is the reference gene; values are mean ± SD vs. control; *p < 0.05, **p < 0.01.