
FIGURE
Fig. 2
- ID
- ZDB-FIG-250122-13
- Publication
- Shezi et al., 2024 - Candidate Gene Expression in Adult Zebrafish Models of Type 2 Diabetes Mellitus
- Other Figures
- All Figure Page
- Back to All Figure Page
Fig. 2
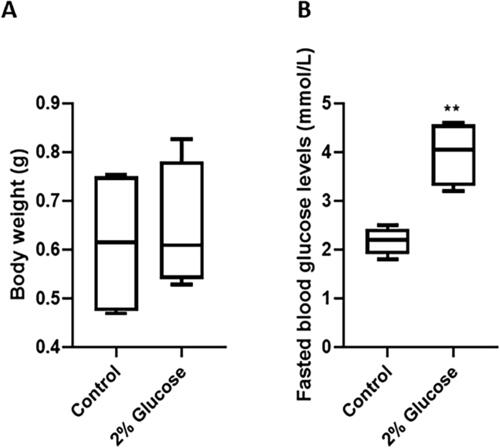
Bodyweight and fasting blood glucose levels of control and glucose-exposed zebrafish. Adult zebrafish were continuously exposed to 2% glucose solution or tank water (control) for 40 days. At day 40, the control group (n = 6) and experimental group (n = 7) were weighed (A), and fasting blood glucose levels measured (B). Data were analyzed using Student’s t-test; values are mean ± standard deviation (SD) vs. control; **p < 0.01. |
Expression Data
Expression Detail
Antibody Labeling
Phenotype Data
Phenotype Detail
Acknowledgments
This image is the copyrighted work of the attributed author or publisher, and
ZFIN has permission only to display this image to its users.
Additional permissions should be obtained from the applicable author or publisher of the image.
Full text @ Zebrafish