
- Title
-
Rotenone exposure causes features of Parkinson`s disease pathology linked with muscle atrophy in developing zebrafish embryo
- Authors
- Ranasinghe, T., Seo, Y., Park, H.C., Choe, S.K., Cha, S.H.
- Source
- Full text @ J. Hazard. Mater.

Rotenone exposure induces toxicity in developing zebrafish embryo. Wild-type embryos aged 7–8 h post fertilization (hpf) were exposed with the indicated concentrations of rotenone. (A) Representative developmental images at 12, 36, and 48 hpf. The arrows denote yolk sac edema at 48 hpf, Scale bar: 200 µm. N = 18. (B) Mortality at 48 hpf. N = 54. Physical sizes were measured at 72 hpf according to (C), Scale bar: 1 mm. (D) Representative image of the phenotype at 72 hpf. The red arrows denote cardiac edema, and the blue arrows denote yolk sac edema. Scale bar: 1 mm. Size of body length (E), (F) yolk sac area, and (G) cardiac area were measured and quantified, N = 18. Data represented as the mean ± SD. SD: standard deviation. * * p < 0.01. ns: not significant. |

Rotenone exposure prompts cascades of proinflammatory cytokines and oxidative stress in developing zebrafish embryos. Wild-type embryos aged 7–8 h post fertilization (hpf) were exposed to 30 nM rotenone until 72 hpf. The mRNA expressions of proinflammatory cytokines, (A) tnf-α (tumor necrosis factor-alpha), (B) il-1β (interleukin-1β), and (C) il-6 (interleukin-6), were measured. N = 24–30. (D) Representative image of reactive oxygen species (ROS) and (E) quantification of ROS intensity using ImageJ software. Scale bar: 1 mm. The mRNA expressions of antioxidant enzymes (F) nrf2 (nuclear factor erythroid 2-related factor 2), (G) cat (catalase), and (H) sod2 (superoxide dismutase 2), N = 24–30. Data presented as the mean ± SD. SD: standard deviation. * p < 0.05, * * p < 0.01, * ** p < 0.001, ns: not significant. |

Rotenone impairs dopamine synthesis and transport and induces accumulation of ɑ-synuclein in developing zebrafish embryos. Wild-type and Tg(huC:zsgreen-p2a-human a-synuclein) aged 7–8 h post fertilization (hpf) embryos were exposed with 30 nM rotenone to 72 hpf. (A) Embedded Specimen orientation. A: anterior, P: posterior, L: left, R: right. Analyzing the gate area indicated by the red dotted line. Scale bar: 10 µm. Tyrosine hydroxylase (TH, th) (B) mRNA expression, Scale bar: 100 µm, (C) representative images of immunohistochemistry, and (D) quantified of TH immunohistochemistry. A: anterior, P: posterior, L: left, R: right. N = 13–20. Scale bar: 10 µm. (E) dopamine transporter (DAT/slc6a3) mRNA expressions. N = 16–20. (F) Representative images of the head area and (G) measured the area of red dotted line. Scale bar: 200 µm. N = 25–28. The mRNA expression of anti-apoptotic gene (H) bcl2 and pro-apoptotic genes (I) caspase-3 and (J) bax. n = 24–30. (K) Representative images of ɑ-synuclein and (L) quantified the ɑ-synuclein. A: anterior, P: posterior, L: left, R: right. Scale bar: 10 µm. N = 7–8. Data are presented as the mean ± SD, SD: standard deviation. * p < 0.05, * * p < 0.01, * ** p < 0.001. |
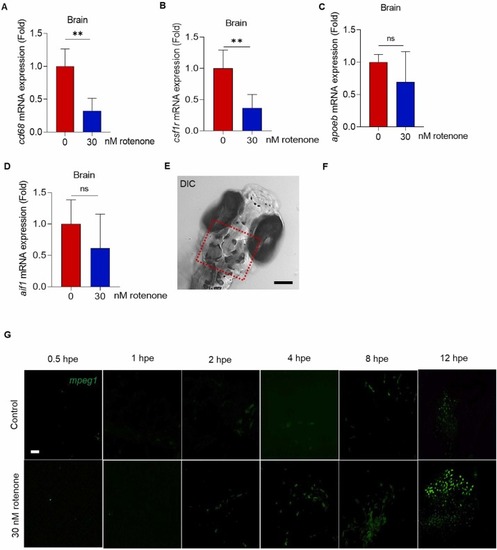
Rotenone exposure accompanying neuroinflammation in developing zebrafish embryos. Wild-type embryos aged 7–8 h post fertilization (hpf) were exposed with 30 nM rotenone to 72 hpf. Tg(mpeg1:EGFP) embryos were exposed to rotenone at 72 hpf for 0.5, 1, 2, 4, 8 and 12 h. The mRNA expressions of (A) cd68 (cluster of differentiation 68), (B) csf1r (colony-stimulating factor 3 receptor), (C) apoeb (apolipoprotein E) (D) aif1 (allograft inflammatory factor 1), N = 20. (E) Midbrain images using confocal microscopy gated with red dots, Scale bar: 10 µm, N = 6. (F) Quantification of mpeg1-expressing number of cell and (G) representative images of Tg(mpeg1:EGFP) at 0.5, 1,2,4,8, and 12 h post exposure (hpe) of rotenone, Scale bar: 10 µm, N = 4–12. Data presented as the mean ± SD. SD: standard deviation. * p < 0.05, * * p < 0.01, * ** p < 0.001, ns: not significant. |
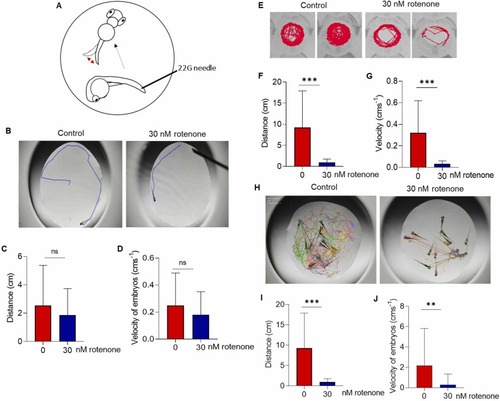
Rotenone exposure induced motor symptoms in developing zebrafish embryos. Wild-type embryos aged 7–8 h post fertilization (hpf) were exposed with 30 nM rotenone to 72 hpf for thigmotaxis, and to 120 hpf for free locomotion. (A) Illustration of the thigmotaxis method. (B) Representative images and the quantification of thigmotaxis as (C) distance (cm), and (D) velocity (cms-1) after the touch response test at 72 hpf, N = 36. (E) Representative images of free locomotive movement at 120 hpf and its (E) swim paths. Quantification of the free locomotion movement as (F) distance and (G) velocity. (H) Representative images of the swim paths after agitation challenge at 120 hpf and quantification of the track length as (I) distance (cm) and (J) velocity (cms-1), N = 36. (K, M) Embryos acclimatized to the dark for 10 min and started alternative light and dark cycles of 5 min for 30 min, (K) Quantification of the free locomotion as distance (cm) in alternative light and dark conditions at 72 (N = 36) and (M) 120 hpf (N = 24), light exposure is denoted by white color background and dark is denoted by ash color blocks of the graphs. Swin paths at 5 min for a light and 6 min for a dark at (L) 72 and (N) 120 hpf. Data presented as the mean ± SD. SD: standard deviation. * p < 0.05, * * p < 0.01, * ** p < 0.001, ns: not significant.,. |

Rotenone exposure induced skeletal muscle atrophy in developing zebrafish embryos. Wild-type and Tg(mito:EGFP) embryos aged 7–8 h post fertilization (hpf) were exposed with 30 nM rotenone to 72 hpf. (A) Representative images of the trunk cross-section diameter 1 (D1) and trunk cross-section diameter 2 (D2). Quantified values of (B) D1 and (C) D2 lengths, Scale bar: 20 µm, N = 36. (D) Representative confocal microscope image of phalloidin-stained muscles with arrows presenting muscle degeneration. Red arrow: muscle fiber crossings at myosepta. Yellow arrow: muscle fiber detachments at myosepta. White star symbol: muscle fiber deformation. Scale bar: 100 µm. (E) Occurrence percentage of muscle degeneration in triplication, N = 6–7 (F) Quantified muscle fiber crossings at myosepta per embryo. (G) Quantified muscle fiber detachment at myosepta, N = 20. The relative mRNA expressions of (H) myostatin mstna, (I) muscle ring finger-1, trim63a, and (J) atrogin-1 with muscle protein degradation function, fbxo32, and (K) protein kinase B (PKB)/Akt, akt1, (L) mechanistic target of rapamycin (mTOR), mtor, and (M) insulin-like growth factor 1, igf-1, N = 24–30. Data presented as the mean ± SD. SD: standard deviation. * p < 0.05, * * p < 0.01, * ** p < 0.001, ns: not significant. |
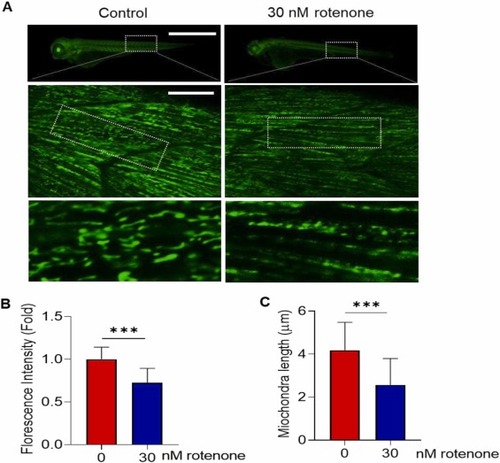
Rotenone exposure induced mitochondria fragmentation in developing zebrafish embryos. Tg(mito:EGFP) embryos aged 7–8 h post fertilization (hpf) were exposed with 30 nM rotenone to 72 hpf. (A) Representative fluorescence (top) and confocal (middle and bottom) microscopic images. Top scale bar: 1 mm, middle scale bar: 10 µm. Quantification of (B) whole body fluorescence intensity and (C) mitochondria length. Ten mitochondria were randomly selected from the dotted box of the middle image of (A), N = 11–12. Data presented as the mean ± SD. SD: standard deviation. * ** p < 0.001, ns: not significant. |
Reprinted from Journal of hazardous materials, 480, Ranasinghe, T., Seo, Y., Park, H.C., Choe, S.K., Cha, S.H., Rotenone exposure causes features of Parkinson`s disease pathology linked with muscle atrophy in developing zebrafish embryo, 136215136215, Copyright (2024) with permission from Elsevier. Full text @ J. Hazard. Mater.