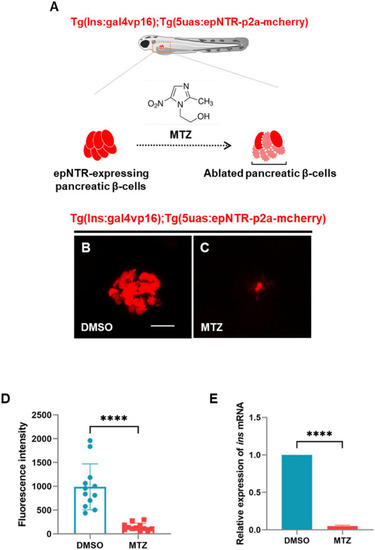
Ablation of pancreatic β-cells induced depletion of insulin production in ins:epNTR-mCherry zebrafish. (A) Schematics of the transgenic zebrafish showing the ablation of pancreatic β-cells using epNTR-mediated chemogenetic ablation system. (B,C) In-vivo fluorescence images showing pancreatic β-cells in Ins:epNTR-mCherry larvae treated with DMSO (B) and MTZ (C) at 9 dpf. (D) Quantification of fluorescence intensity in mcherry-expressing pancreatic β-cells from panel (B) and (C), ****p < 0.0001, t-test (n = 12 larvae per group). (E) Quantification of expression of ins mRNA in transgenic larvae, ****p < 0.0001, t-test (n = 15 larvae per group). Scale bar, 20 μm in (B).

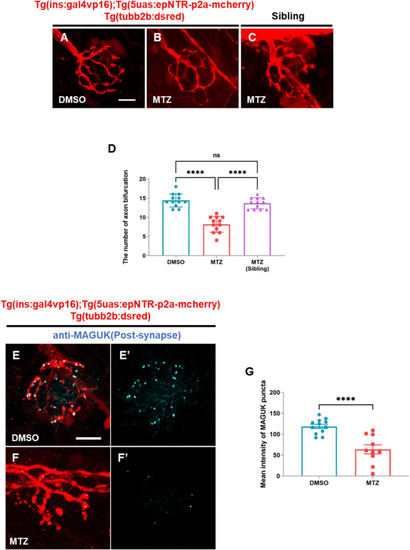
Depletion of insulin production caused peripheral neuropathy in the peripheral lateral line nerve of ins:epNTR-mCherry zebrafish. (A–C)In-vivo fluorescence images showing sensory nerve endings in Ins:epNTR-mCherry expressing Tg (tubb2b:dsred) larvae treated with DMSO (A) and MTZ (B) at 9 dpf. In-vivo fluorescence images showing sensory nerve endings in Tg (tubb2b:dsred) siblings treated with MTZ (C) at 9 dpf. (D) Quantification of the number of axon bifurcation from panel (A–C), ****p < 0.0001, one-way ANOVA (n = 12 larvae per group). (E–F’) Fluorescence images showing sensory nerve endings with postsynaptic MAGUK+ puncta in Ins:epNTR-mCherry expressing Tg (tubb2b:dsred) larvae treated with DMSO (E,E’) and MTZ (F,F’) at 9 dpf. (G) Quantification of fluorescence intensity of MAGUK+ puncta in the transgenic larvae presented in panels (E’) and (F’), ****p < 0.0001, t-test (n = 12 in DMSO group and n = 10 in MTZ group). Scale bar, 10 μm in (A) and (E).

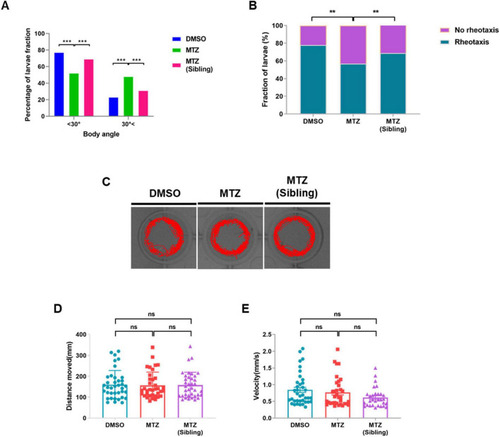
Depletion of insulin production results in defective rheotaxis behavior, but not locomotor behavior, in ins:epNTR-mCherry zebrafish. (A) Quantification of the distribution of the Ins:epNTR-mCherry larvae performing rheotactic angles following treatment with DMSO and MTZ, and siblings treated with MTZ at 9 dpf, ***p = 0.0004, Chi-squared test (n = 15 larvae per group). (B) Quantification of the percentage of the transgenic larvae showing rheotactic behavior following treatment with DMSO and MTZ, and siblings with MTZ at 9 dpf, **p = 0.0064, Chi-squared test (n = 15 larvae per group). (C) Tracking visualization of the transgenic larvae performing free locomotion in light state at 9 dpf. (D,E) Quantification of the distance moved (mm) (D) and velocity (mm/s) (E) from the transgenic larvae performing free locomotion under light conditions following treatment with DMSO and MTZ, and sibling with MTZ at 9 dpf (n = 32 larvae per group).

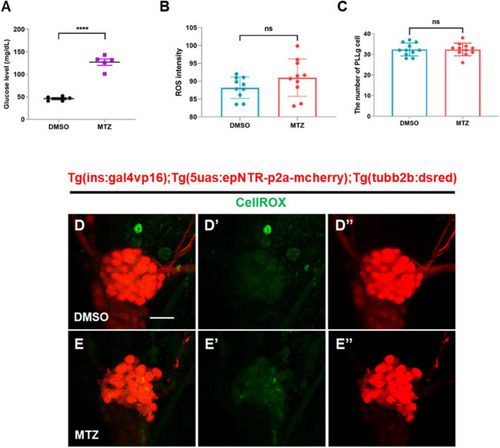
Depletion of insulin production elevates glucose levels, but not ROS, in ins:epNTR-mCherry zebrafish. (A) Quantification of the glucose levels (mg/dL) in Ins:epNTR-mCherry larvae treated with DMSO and MTZ at 9 dpf, ****p < 0.0001, t-test (n = 20 larvae per one data point, total n = 100 larvae per group). (B) Quantification of the ROS intensity in the PLLg cells of Ins:epNTR-mCherry expressing Tg (tubb2b:dsred) larvae presented in panels (D’) and (E’) (n = 10 larvae per group). (C) Quantification of the number of PLLg cells of the transgenic larvae presented in panels (D”) and (E”) (n = 11 larvae per group). (D–E”)In-vivo fluorescence images showing PLLg cell and CellROX ROS detector in the transgenic larvae treated with DMSO (D–D”) or MTZ (E–E”) at 9 dpf. Scale bar, 20 μm in (D).

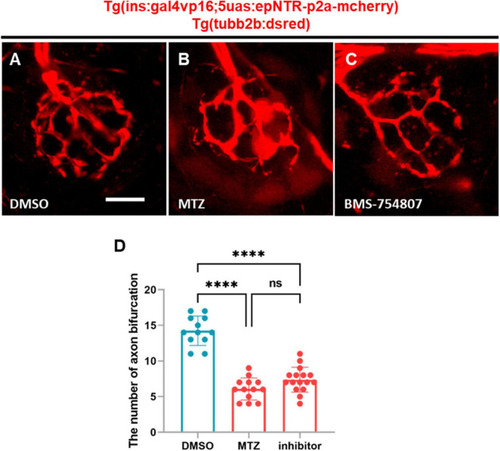
BMS-754807-induced IR inhibition reduces PLL nerve endings in ins:epNTR-mCherry zebrafish. (A–C). In-vivo fluorescence images showing sensory nerve endings in Ins:epNTR-mCherry expressing Tg (tubb2b:dsred) larvae treated with DMSO (A), MTZ, (B) and BMS-754807 (C) at 9 dpf. (D) Quantification of the number of axon bifurcation as depicted in panels (A–C), ****p < 0.0001, one-way ANOVA (n = 12 larvae in the DMSO group, n = 13 larvae in the MTZ group, and n = 16 larvae in the inhibitor group). Scale bar, 10 μm in (A).

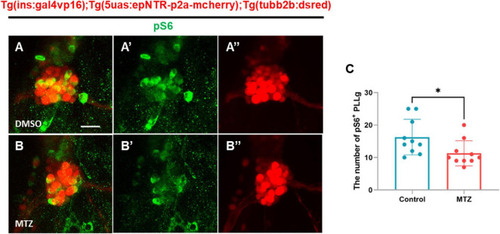
Depletion of insulin production downregulates the mTOR signaling pathway in the PLLg in ins:epNTR-mCherry zebrafish. (A–B”) Fluorescence images showing the PLLg and pS6+ cells in Ins:epNTR-mCherry expressing Tg (tubb2b:dsred) larvae treated with DMSO (A–A”) and MTZ (B–B”) at 9 dpf. (C) Quantification of the number of pS6+ PLLg cells from panels (A) and (B), *p = 0.0305, t-test (n = 10 larvae per group). Scale bar, 20 μm in (A).

Acknowledgments
This image is the copyrighted work of the attributed author or publisher, and ZFIN has permission only to display this image to its users. Additional permissions should be obtained from the applicable author or publisher of the image. Full text @ Front. Cell. Neurosci.