IMAGE

FIGURE 4

ID
ZDB-IMAGE-241017-107
Source
Figures for Lee et al., 2024
Image
Figure Caption

FIGURE 4

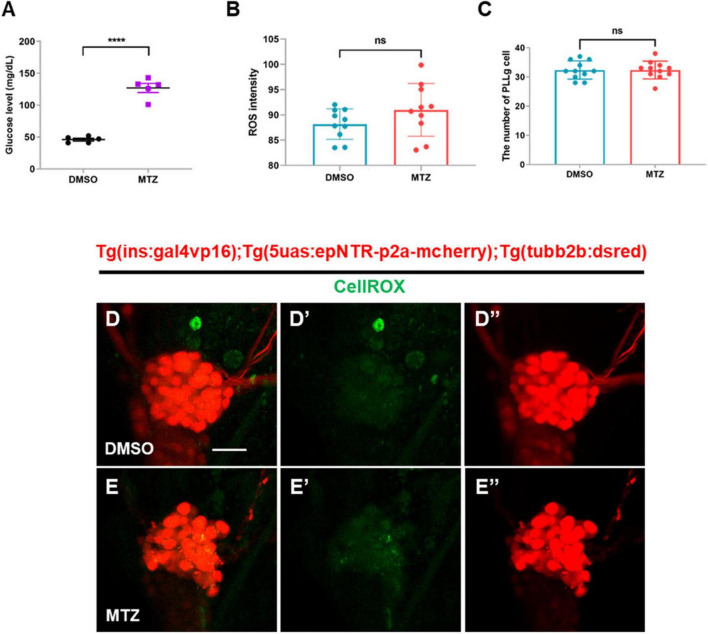
Depletion of insulin production elevates glucose levels, but not ROS, in ins:epNTR-mCherry zebrafish. (A) Quantification of the glucose levels (mg/dL) in Ins:epNTR-mCherry larvae treated with DMSO and MTZ at 9 dpf, ****p < 0.0001, t-test (n = 20 larvae per one data point, total n = 100 larvae per group). (B) Quantification of the ROS intensity in the PLLg cells of Ins:epNTR-mCherry expressing Tg (tubb2b:dsred) larvae presented in panels (D’) and (E’) (n = 10 larvae per group). (C) Quantification of the number of PLLg cells of the transgenic larvae presented in panels (D”) and (E”) (n = 11 larvae per group). (D–E”)In-vivo fluorescence images showing PLLg cell and CellROX ROS detector in the transgenic larvae treated with DMSO (D–D”) or MTZ (E–E”) at 9 dpf. Scale bar, 20 μm in (D).

Acknowledgments
This image is the copyrighted work of the attributed author or publisher, and ZFIN has permission only to display this image to its users. Additional permissions should be obtained from the applicable author or publisher of the image. Full text @ Front. Cell. Neurosci.