IMAGE

FIGURE 1

ID
ZDB-IMAGE-241017-103
Source
Figures for Lee et al., 2024
Image
Figure Caption

FIGURE 1

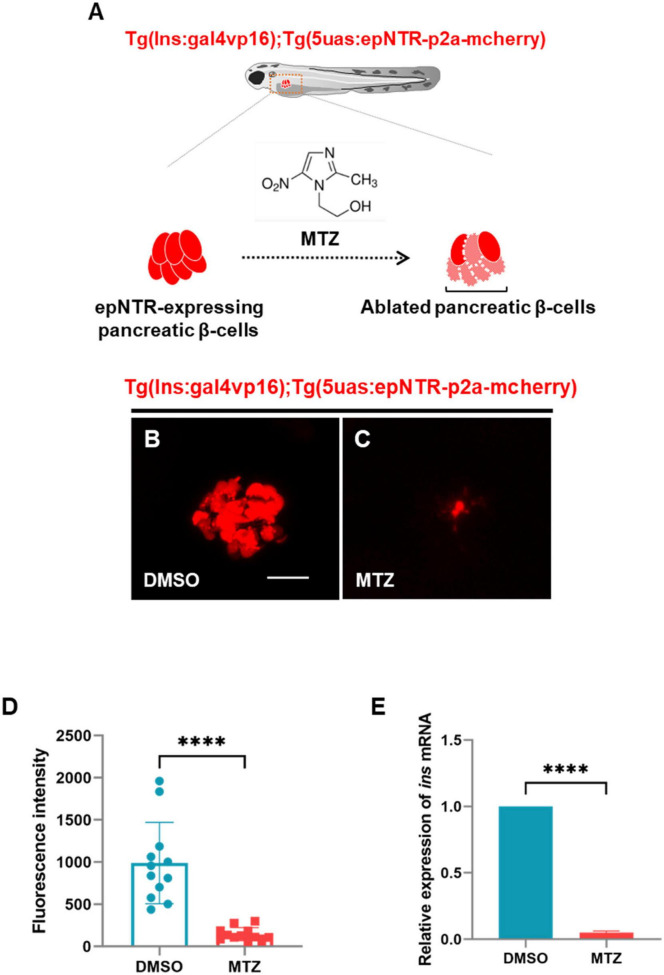
Ablation of pancreatic β-cells induced depletion of insulin production in ins:epNTR-mCherry zebrafish. (A) Schematics of the transgenic zebrafish showing the ablation of pancreatic β-cells using epNTR-mediated chemogenetic ablation system. (B,C) In-vivo fluorescence images showing pancreatic β-cells in Ins:epNTR-mCherry larvae treated with DMSO (B) and MTZ (C) at 9 dpf. (D) Quantification of fluorescence intensity in mcherry-expressing pancreatic β-cells from panel (B) and (C), ****p < 0.0001, t-test (n = 12 larvae per group). (E) Quantification of expression of ins mRNA in transgenic larvae, ****p < 0.0001, t-test (n = 15 larvae per group). Scale bar, 20 μm in (B).

Acknowledgments
This image is the copyrighted work of the attributed author or publisher, and ZFIN has permission only to display this image to its users. Additional permissions should be obtained from the applicable author or publisher of the image. Full text @ Front. Cell. Neurosci.