
- Title
-
Single-cell RNA sequencing reveals the heterogeneity and interactions of immune cells and Müller glia during zebrafish retina regeneration
- Authors
- Xu, H., Cao, L., Chen, Y., Zhou, C., Xu, J., Zhang, Z., Li, X., Liu, L., Lu, J.
- Source
- Full text @ Neural Regen Res
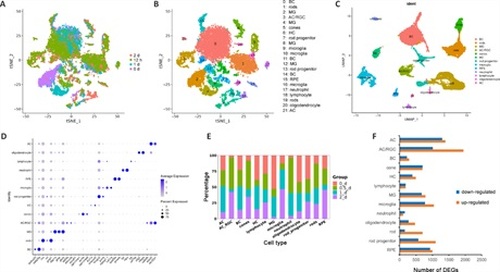
Characterization of zebrafish retinal cell types by scRNAseq.(A–C) Clustering of retinal cells in intact and stab-injured zebrafish retinas by t-SNE and UMAP. Cluster 3 expressing both AC and RGC markers was designated as AC/RGC or AC_RGC. (D) Cell type–specific marker genes. (E) Cell type composition of retinal cells from all four time points tested. (F) The number of DEGs in each cell type in the uninjured and injured retina. Uninjured group: 0 d; injured group: 12 hours, 1 day, and 2 days samples combined. DEGs were defined using the following criteria: P < 0.01, log2FC ≥ 0.26. AC: Amacrine cells; BC: bipolar cell; DEGs; differentially expressed genes; HC: horizontal cells; MG: Müller glia; RGC: retinal ganglion cells; RPE: retinal pigment epithelium; t-SNE: t-distributed stochastic neighbor embedding; UMAP: Uniform Manifold Approximation and Projection. |

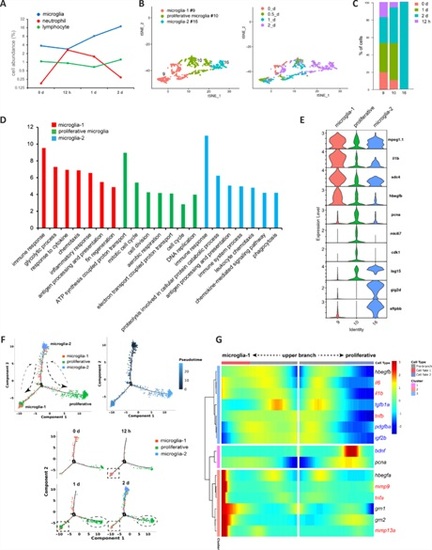
Analysis of MG heterogeneity and status transition in intact and stab-injured zebrafish retinas.(A) Clustering of the four MG subtypes together with rod progenitor cells. (B) Marker genes for MG subtypes and rod progenitors. (C) Cell population composition in terms of each MG subtype and rod progenitor cells. (D) Gene Ontology (GO) analysis showing the enriched biological processes in MG subtypes and rod progenitor cells. (E) Pseudotime analysis of MG subtypes and rod progenitor cells performed using Monocle2 software. (F) RNA velocity analysis showing the trajectories of MG and rod progenitor cells. Arrows indicate the direction of cell status transition. (G) Branched Expression Analysis Modeling (BEAM) of branch-dependent gene expression in MG and rod progenitor cells. MG: Müller glia. |
Characterization of microglial heterogeneity and state changes in intact and stab-injured zebrafish retinas.(A) Abundance of different immune cell types in the retinal samples at each time point tested. (B) Clustering of microglia subtypes. (C) Cell population composition in terms of the three microglial subtypes. (D) GO analysis showing the enriched biological processes in the microglia subtypes. (E) Subtype-specific marker genes. (F) Pseudotime analysis of microglial subtypes. (G) BEAM analysis of secreted factors during microglial state transition. Red, pro-inflammatory factors; blue, anti-inflammatory factors. BEAM: Branched Expression Analysis Modeling; GO: Gene Ontology. |
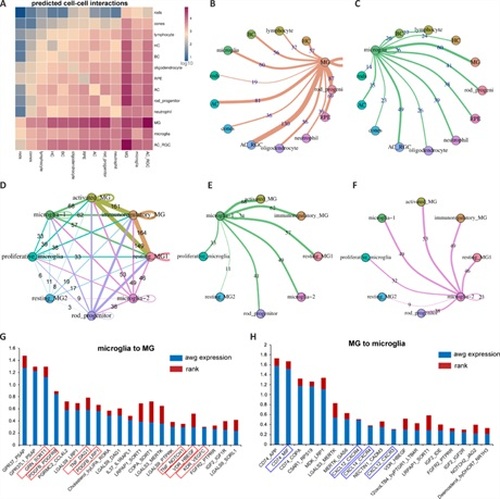
Analysis of cell-cell interactions between immune cells and MG in intact and stab-injured zebrafish retinas.(A) CellphoneDB analysis showing possible cell-cell interactions within the retina. (B, C) The number of interactions between MG and microglia and other cell types, as assessed using CellphoneDB. (D) The number of interactions among different MG and microglia subtypes together with rod progenitor cells. (E, F) The number of interactions among microglia-1 and microglia-2 and other microglia and MG subtypes. (G, H) List of the most significant ligand-receptor pairs identified between microglia and MG. microglia to MG, ligand expressed by microglia and receptor expressed by MG; MG to microglia, vice versa; awg expression, the average expression level of target pairs in both cells; rank, the distinctiveness of identified pairs in MG and microglia compared to other cell types; MG: Müller glia. |

Inflammation regulates MG Jak1–Stat3 signaling in zebrafish retinas subjected to stab injury.(A) Violin plot showing the expression of Jak1–Stat3 signaling components in MG and rod progenitors. (B) BEAM analysis of Jak1–Stat3 signaling components (blue) and other markers during MG status transition. (C) Jak1–Stat3 signaling component expression levels in MG at the four time points tested. (D) qPCR analysis of the expression of socs3b, stat3, and inflammatory cytokines in uninjured and stab-injured zebrafish retinas. (E) qPCR analysis of Jak1–Stat3 signaling component expression in stab-injured retinas and were treated with PBS or Dex compared with uninjured retinas (0 days). (F) FISH analysis showing co-localization (arrows) of socs3b mRNA with GFP in the retinas of Tg(gfap:GFP) transgenic fish. (G) FISH showing socs3b mRNA expression in PBS- or Dex-treated retinas at 12 hpi. (H) Zym injection into uninjured retinas induced expression of Jak1–Stat3 signaling components, as assessed by qPCR. (I) Dex treatment suppressed the expression of Stat3-activating cytokines in the injured retina, as assessed by qPCR. (J, K) Microglial ablation by MTZ treatment of Tg(mpeg1:nsfB-mCherry) fish significantly reduced Jak1–Stat3 signaling component expression in the retina. (L) Quantification of proliferating INL cells at 3 dpi in retinas that received the indicated treatments. White asterisks in G and J indicate the site of the stab injury. Data are expressed as mean ± SEM (n = 3).*P < 0.05, **P < 0.01, vs. PBS or control group (one-way analysis of variance followed by Tukey’s post hoc test). BEAM: Branched Expression Analysis Modeling; Dex: dexamethasone; dpi: day post-injury; FISH: fluorescence in situ hybridization; GCL: ganglion cell layer; hpi: hours post-injury; INL: inner nuclear layer; MG: Müller glia; MTZ: metronidazole; ONL: outer nuclear layer; PBS: phosphate-buffered saline; qPCR: quantitative polymerase chain reaction; Zym: zymosan A. |
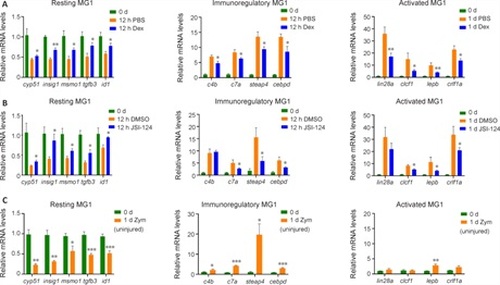
Inflammation and Jak1-Stat3 signaling regulate MG status transition during zebrafish retina regeneration.(A) qPCR analysis comparing the expression of MG subtype markers in uninjured control (0 d) and PBS- or Dex-treated zebrafish retinas 12 hours or 1 day post-injury. (B) qPCR analysis of the expression of MG subtype markers in uninjured control (0 d) and DMSO- or JSI-124–treated zebrafish retinas 12 hours or 1 day post-injury. (C) qPCR demonstrating the expression of MG subtype markers in uninjured control (0 d) and Zym-treated retinas 1 day post-injection. *P < 0.05, **P < 0.01, ***P < 0.001, vs. PBS or DMSO control in A and B, and with uninjured control in C (Student’s t-test [two tails, unpaired]). Dex: Dexamethasone; DMSO: dimethyl sulfoxide; MG: Müller glia; PBS: phosphate-buffered saline; qPCR: quantitative polymerase chain reaction; Zym: zymosan A. |