
|
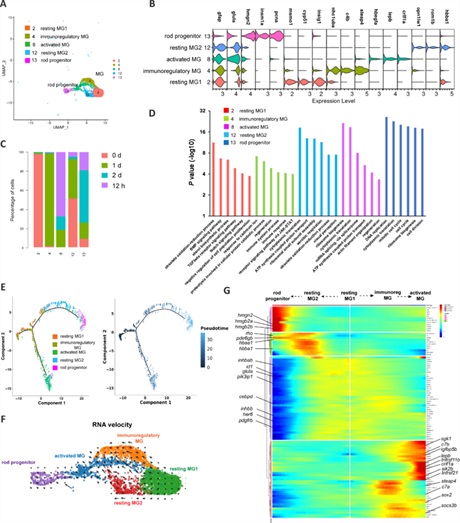
Fig. 2 Analysis of MG heterogeneity and status transition in intact and stab-injured zebrafish retinas.(A) Clustering of the four MG subtypes together with rod progenitor cells. (B) Marker genes for MG subtypes and rod progenitors. (C) Cell population composition in terms of each MG subtype and rod progenitor cells. (D) Gene Ontology (GO) analysis showing the enriched biological processes in MG subtypes and rod progenitor cells. (E) Pseudotime analysis of MG subtypes and rod progenitor cells performed using Monocle2 software. (F) RNA velocity analysis showing the trajectories of MG and rod progenitor cells. Arrows indicate the direction of cell status transition. (G) Branched Expression Analysis Modeling (BEAM) of branch-dependent gene expression in MG and rod progenitor cells. MG: Müller glia.