FIGURE SUMMARY
Title

Bone Formation in Zebrafish: The Significance of DAF-FM DA Staining for Nitric Oxide Detection

Authors
Huysseune, A., Larsen, U.G., Larionova, D., Matthiesen, C.L., Petersen, S.V., Muller, M., Witten, P.E.
Source
Full text @ Biomolecules

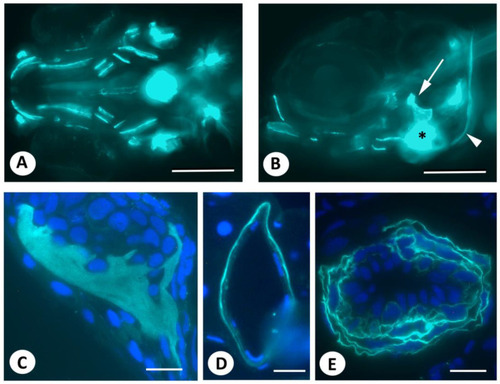
Live staining of early postembryonic zebrafish embryos with DAF-FM DA. (A,B). Live staining with DAF-FM DA, according to published protocols, reveals signals in bony structures (opercular, arrow; cleithrum, arrowhead), as well as in the heart (asterisk) and around the notochord, which is consistent with earlier reports. Axio Observer image. (CE). Three µm GMA sections of the specimen shown in (A,B), counterstained with DAPI, showing the opercular bone (C), notochord (D), and bulbus arteriosus (E). Note that nuclei lie outside fluorescent domains. Scale bars in (A,B) = 200 µm, in (C,E) = 20 µm, in (D) = 10 µm.

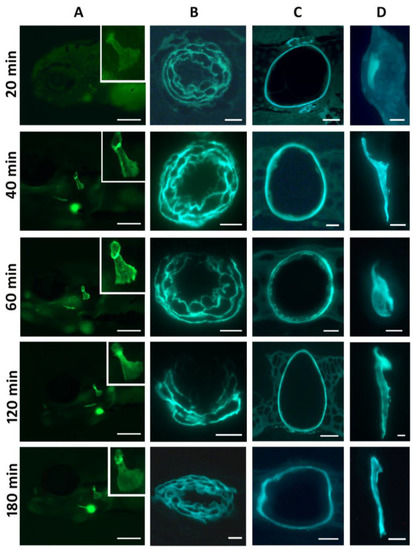
Live staining of 5 dpf zebrafish embryos with DAF-FM DA for short intervals. Column (A): live imaging of the head region at the time indicated on the left; inset: magnification of the opercular bone. The strong blurred signal visible ventrally is the bulbus arteriosus. Scale bars = 200 µm. Columns (BD): 3 µm GMA sections of the corresponding embryos. Column (B): bulbus arteriosus. Scale bars = 10 µm. (C): notochord in the head region. Scale bars = 20 µm except for 60 min: 10 µm. (D): opercular bone. Scale bars = 10 µm except for 40 min: 20 µm. Column (A): anterior to the left; (B,C): dorsal to the top; (D): lateral to the left.

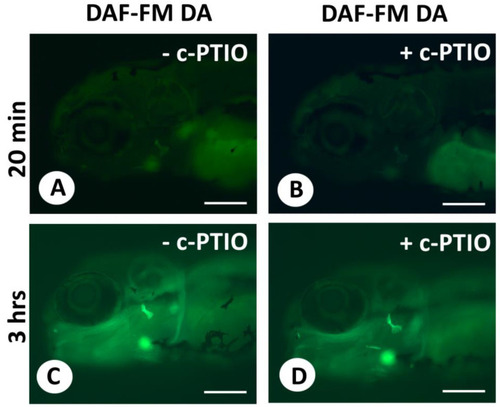
Live staining of 5 dpf zebrafish with DAF-FM DA after the use of the NO scavenger c-PTIO. (AD). Live staining of 5 dpf zebrafish for 20 min (A,B) or 3 h (C,D) with DAF-FM DA either without c-PTIO (A,C) or after 30 min treatment with the NO scavenger c-PTIO (B,D). All images were taken strictly under the same illumination. Scale bars = 200 µm.

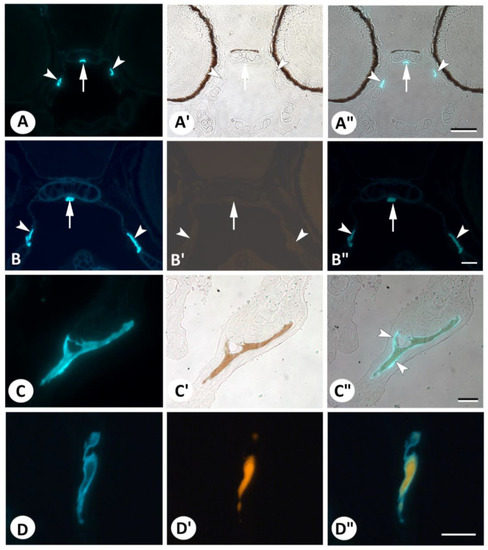
Comparison of DAF-FM DA-stained structures with staining for mineralized tissue. (AA″). Overview section of DAF-FM DA live-stained 5 dpf zebrafish (A) stained with Von Kossa for mineralized structures (A′) and overlay (A″). Note the absence of Von Kossa staining in the para-sphenoid (arrow) and entopterygoid bones (arrowheads). (BB″). Overview section of a DAF-FM DA live-stained 5 dpf zebrafish (B) stained with Alizarin red S for mineralized structures (B′) and overlay (B″). The image is dark because of the complete absence of Alizarin red S staining in the parasphenoid (arrow) and entopterygoid bones (arrowheads) (compared with the positive staining of mineralized bone in D′). (CC″). Details of the opercular bone in a section of a DAF-FM DA live-stained 5 dpf zebrafish (C) stained with Von Kossa for mineralized structures (C′) and overlay (C″). Note the distinct zone of DAF-FM DA-positive staining around the area positive for minerals using Von Kossa (arrowheads). (DD″). Details of the opercular bone in a section of a DAF-FM DA live-stained 5 dpf zebrafish (D) stained with Alizarin red S for mineralized structures (D′) and overlay (D″). Note that the DAF-FM DA-positive area is clearly larger than the area marked with Alizarin red S. Scale bar for (AA″) = 50 µm and for (BB″) to (DD″) = 20 µm.

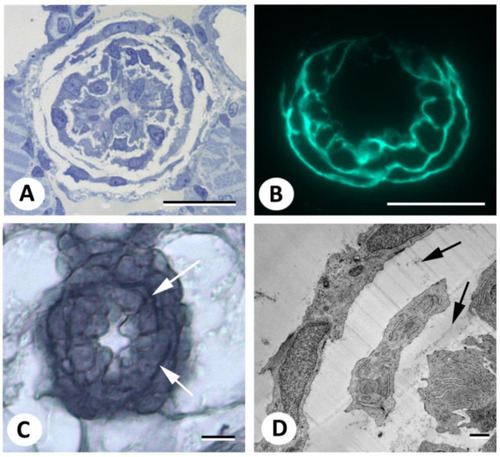
Demonstration of elastic fibers in the bulbus arteriosus. (A). Semithin Toluidine blue-stained cross section of the bulbus arteriosus in a 5 dpf zebrafish. (B). Section of the bulbus after live staining of a 5 dpf zebrafish with DAF-FM DA. (C). Elastin staining of the bulbus according to an adapted Verhoeff’s stain. (D). TEM image of the bulbus of a 5 dpf zebrafish. Arrows indicate the ECM (elastin fibers in (C)). Scale bars in (AC) = 20 µm, in (D) = 1 µm.

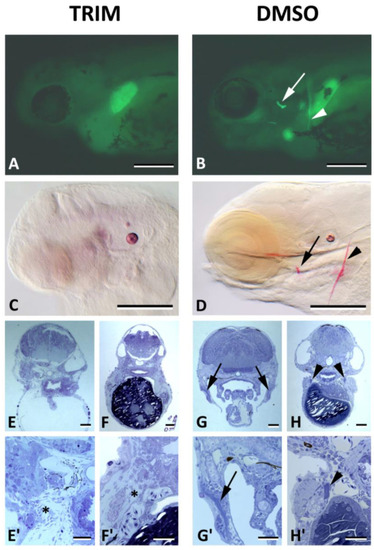
Absence of bone after inhibition of NO formation. (A,B). Live staining of 5 dpf zebrafish with DAF-FM DA for 3 h in the dark after 90 h of treatment with the NOS inhibitor TRIM (A) or its solvens (0.1% DMSO) (B). Note the presence of opercular bone (arrow) and cleithrum (arrowhead) in the control, which are clearly absent in the TRIM-treated specimen. (C,D). Alizarin red S whole mount staining of TRIM-treated embryos likewise shows the complete absence of bones (C) compared to their presence in control embryos (D). Arrow: opercular bone; arrowhead: cleithrum. (EH′). Semithin sections at comparative cross-sectional levels show the absence of opercular bone and cleithrum ((E,F), and higher magnification in (E′,F′)) compared to their distinct presence in control embryos ((G,H), and their higher magnification in (G′,H′)). Opercular bone: arrow; cleithrum: arrowhead; asterisks indicate the location of absent bones. Scale bars in (A,B) = 200 µm, in (EH) = 100 µm, in (E′H′) = 50 µm.

Acknowledgments
This image is the copyrighted work of the attributed author or publisher, and ZFIN has permission only to display this image to its users. Additional permissions should be obtained from the applicable author or publisher of the image. Full text @ Biomolecules