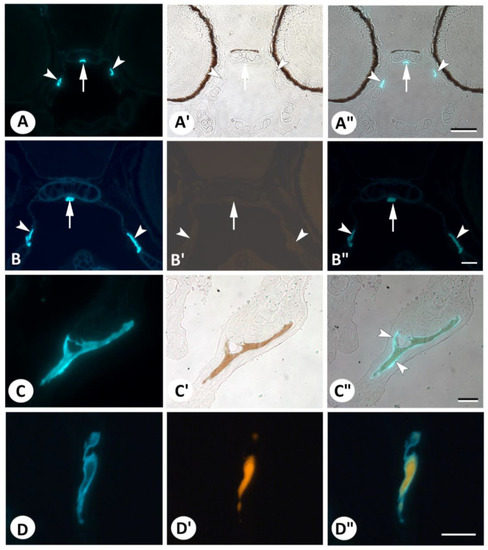
Comparison of DAF-FM DA-stained structures with staining for mineralized tissue. (A–A″). Overview section of DAF-FM DA live-stained 5 dpf zebrafish (A) stained with Von Kossa for mineralized structures (A′) and overlay (A″). Note the absence of Von Kossa staining in the para-sphenoid (arrow) and entopterygoid bones (arrowheads). (B–B″). Overview section of a DAF-FM DA live-stained 5 dpf zebrafish (B) stained with Alizarin red S for mineralized structures (B′) and overlay (B″). The image is dark because of the complete absence of Alizarin red S staining in the parasphenoid (arrow) and entopterygoid bones (arrowheads) (compared with the positive staining of mineralized bone in D′). (C–C″). Details of the opercular bone in a section of a DAF-FM DA live-stained 5 dpf zebrafish (C) stained with Von Kossa for mineralized structures (C′) and overlay (C″). Note the distinct zone of DAF-FM DA-positive staining around the area positive for minerals using Von Kossa (arrowheads). (D–D″). Details of the opercular bone in a section of a DAF-FM DA live-stained 5 dpf zebrafish (D) stained with Alizarin red S for mineralized structures (D′) and overlay (D″). Note that the DAF-FM DA-positive area is clearly larger than the area marked with Alizarin red S. Scale bar for (A–A″) = 50 µm and for (B–B″) to (D–D″) = 20 µm.
|
