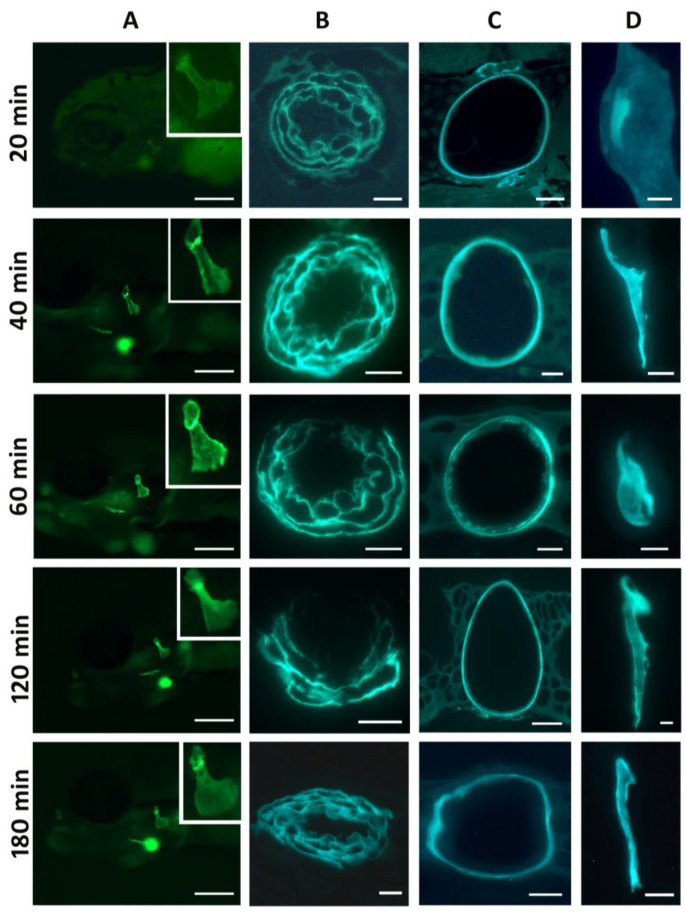
Live staining of 5 dpf zebrafish embryos with DAF-FM DA for short intervals. Column (A): live imaging of the head region at the time indicated on the left; inset: magnification of the opercular bone. The strong blurred signal visible ventrally is the bulbus arteriosus. Scale bars = 200 µm. Columns (B–D): 3 µm GMA sections of the corresponding embryos. Column (B): bulbus arteriosus. Scale bars = 10 µm. (C): notochord in the head region. Scale bars = 20 µm except for 60 min: 10 µm. (D): opercular bone. Scale bars = 10 µm except for 40 min: 20 µm. Column (A): anterior to the left; (B,C): dorsal to the top; (D): lateral to the left.
Acknowledgments
This image is the copyrighted work of the attributed author or publisher, and
ZFIN has permission only to display this image to its users.
Additional permissions should be obtained from the applicable author or publisher of the image.
Full text @ Biomolecules
Your Input Welcome
Thank you for submitting comments. Your input has been emailed to ZFIN curators who may contact you if
additional information is required.
Oops. Something went wrong. Please try again later.