FIGURE

Figure 2

ID
ZDB-FIG-231225-183
Publication
Huysseune et al., 2023 - Bone Formation in Zebrafish: The Significance of DAF-FM DA Staining for Nitric Oxide Detection
Other Figures
All Figure Page
Back to All Figure Page
Figure 2

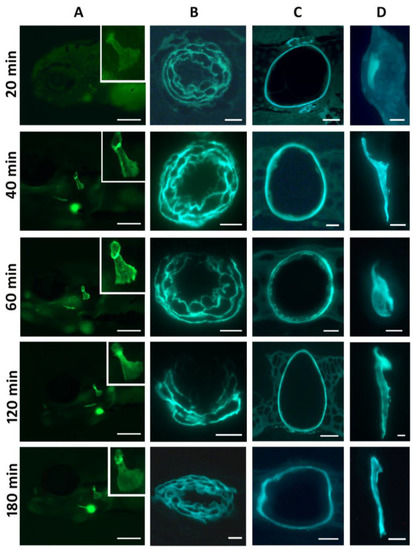
Live staining of 5 dpf zebrafish embryos with DAF-FM DA for short intervals. Column (A): live imaging of the head region at the time indicated on the left; inset: magnification of the opercular bone. The strong blurred signal visible ventrally is the bulbus arteriosus. Scale bars = 200 µm. Columns (BD): 3 µm GMA sections of the corresponding embryos. Column (B): bulbus arteriosus. Scale bars = 10 µm. (C): notochord in the head region. Scale bars = 20 µm except for 60 min: 10 µm. (D): opercular bone. Scale bars = 10 µm except for 40 min: 20 µm. Column (A): anterior to the left; (B,C): dorsal to the top; (D): lateral to the left.

Expression Data

Expression Detail
Antibody Labeling
Phenotype Data

Phenotype Detail
Acknowledgments
This image is the copyrighted work of the attributed author or publisher, and ZFIN has permission only to display this image to its users. Additional permissions should be obtained from the applicable author or publisher of the image. Full text @ Biomolecules