
Fig. 4
- ID
- ZDB-FIG-250423-47
- Publication
- Wang et al., 2025 - Wdr5-mediated H3K4 methylation facilitates HSPC development via maintenance of genomic stability in zebrafish
- Other Figures
- All Figure Page
- Back to All Figure Page
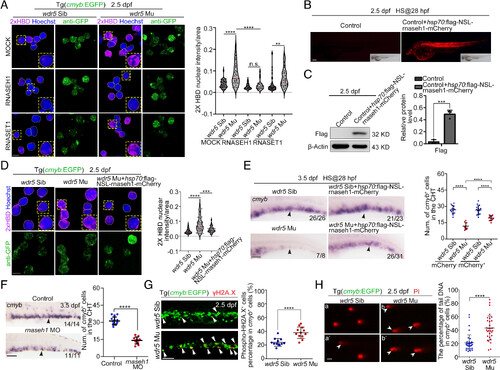
Wdr5 loss facilitates aberrant R-loops accumulation and further leads to DNA damage. (A) IF (Left) and statistical data (Right, n > 30) showing the signals of 2xHBD in HSPCs of siblings and wdr5 mutants with Tg(cmyb:EGFP) background. Cell smears were mock-treated or pretreated with RNase H1 and RNase T1 for 1 h at 37 °C after blocking, and prior to 2×HBD staining. Error bar, mean ± SD, n.s.: no significance, **P ≤ 0.01, ****P ≤ 0.0001. (Scale bar, 5 μm). (B) The imaging of mCherry fluorescence in control and embryos injected with hsp70:flag-rnaseh1-mCherry plasmids at 2.5 dpf. (Scale bar, 200 μm). (C) Western blotting (Left) and statistical data (Right) showing the level of Flag-Rnaseh1 protein in the CHT region of control and embryos injected with hsp70:flag-rnaseh1-mCherry plasmids at 2.5 dpf. rnaseh1 driven by hsp70 promoter were induced by heat shock at 28 hpf. Error bar, mean ± SD, ***P≤ 0.001. (D) IF (Left) and statistical data (Right, n > 32) showing the signals of 2×HBD in the HSPCs of siblings, wdr5 mutants, and wdr5 mutants injected with hsp70:flag-rnaseh1-mCherry plasmids at 2.5 dpf. Error bar, mean ± SD, ***P ≤ 0.001, ****P ≤ 0.0001. (Scale bar, 5 μm). (E) WISH (Left) and statistical data (Right) showing the expression of cmyb (black arrowheads) in the CHT region of siblings, wdr5 mutants, siblings injected with hsp70:flag-rnaseh1-mCherry plasmids and wdr5 mutants injected with hsp70:flag-rnaseh1-mCherry plasmids at 3.5 dpf. Error bar, mean ± SD, ****P ≤ 0.0001. (Scale bar, 100 μm). (F) WISH (Left) and statistical data (Right) showing the expression of cmyb (black arrowheads) in the control embryos and rnaseh1 morphants at 3.5 dpf. Error bar, mean ± SD, ****P ≤ 0.0001 (Scale bar, 100 μm). (G) IF (Left) and statistical data (Right) showing the signals of γH2AX (white arrowheads) in the CHT region of siblings and wdr5 mutants with Tg(cmyb:EGFP) background at 2.5 dpf. Error bar, mean ± SD, ****P ≤ 0.0001. (Scale bar, 50 μm). (H) Alkaline comet assay (Left) and statistical data (Right) showing the level of DNA damage in cmyb+ cells (white arrowheads) in the CHT region of siblings and wdr5 mutants with Tg(cmyb:EGFP) background at 2.5 dpf. Error bar, mean ± SD, ****P ≤ 0.0001. (Scale bar, 20 μm). |