
Fig. 2
- ID
- ZDB-FIG-250423-45
- Publication
- Wang et al., 2025 - Wdr5-mediated H3K4 methylation facilitates HSPC development via maintenance of genomic stability in zebrafish
- Other Figures
- All Figure Page
- Back to All Figure Page
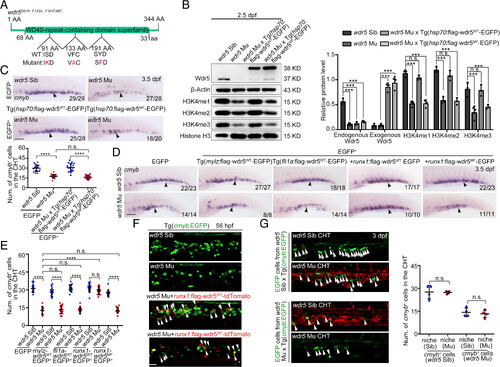
Wdr5-mediated H3K4 methylation regulates CHT HSPC development in a cell-autonomous manner. (A) The amino acids (in red) of zebrafish Wdr5 were mutated in order to generate Wdr5S91K, F133A, Y191F, which is abbreviated as Wdr5MF. (B) Western blotting (Left) and statistical data (Right) showing the protein level of wdr5 and the level of H3K4me1, H3K4me2, and H3K4me3 in the CHT region from siblings, wdr5 mutants, wdr5 mutant×Tg(hsp70:flag-wdr5WT-EGFP) and wdr5 mutant×Tg (hsp70:flag-wdr5MF-EGFP) at 2.5 dpf. wdr5WT and wdr5MF driven by hsp70 promoter was induced by heat shock at 28 hpf. Error bar, mean ± SD, n.s.: no significance, ***P ≤ 0.001. (C) WISH (up) and statistical data (down) showing the expression of cmyb (black arrowheads) in the CHT region of siblings, wdr5 mutants, wdr5 mutant×Tg(hsp70:flag-wdr5WT-EGFP) and wdr5 mutant×Tg(hsp70:flag-wdr5MF-EGFP) at 3.5 dpf. wdr5WT and wdr5MF driven by hsp70 promoter were induced by heat shock at 28 hpf. (Scale bar, 100 μm). Error bar, mean ± SD, n.s.: no significance, ****P ≤ 0.0001. (D) WISH showing the expression of cmyb (black arrowheads) in the CHT region of siblings, wdr5 mutants, wdr5 mutant×Tg(mylz:flag-wdr5WT-EGFP), wdr5 mutant×Tg(fli1a:flag-wdr5WT-EGFP) and wdr5 mutants injected with runx1:flag-wdr5WT-EGFP or runx1:flag-wdr5MF-EGFP plasmids at 3.5 dpf. (Scale bar, 100 μm). (E) Statistical data of the WISH (D). Error bar, mean ± SD, n.s.: no significance, ****P ≤ 0.0001. (F) Confocal imaging of cmyb+ HSPCs (white arrowheads) in the CHT region of siblings, wdr5 mutants, and wdr5 mutants injected with runx1:flag-wdr5WT-tdTomato or runx1:flag-wdr5MF-tdTomato plasmids at 56 hpf. (Scale bar, 50 μm). (G) Confocal imaging (Left) and statistical data (Right) of parabiosis generated between siblings or wdr5 mutants with Tg(cmyb:EGFP) or Tg(kdrl:mCherry) background. White arrowheads showing the cmyb:EGFP+ cells from siblings or wdr5 mutants in different niche (the CHT region in siblings and wdr5 mutants). Error bar, mean ± SD, n.s.: no significance. (Scale bar, 20 μm). |