
- Title
-
Wdr5-mediated H3K4 methylation facilitates HSPC development via maintenance of genomic stability in zebrafish
- Authors
- Wang, X., Liu, M., Zhang, Y., Ma, D., Wang, L., Liu, F.
- Source
- Full text @ Proc. Natl. Acad. Sci. USA
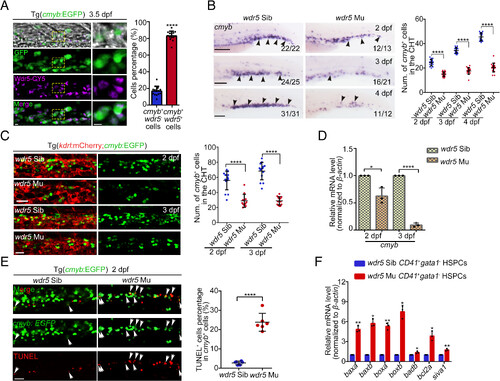
wdr5 is required for HSPC survival in the CHT region. (A) IF (Left) and statistical data (Right) showing the expression pattern of Wdr5 protein in Tg(cmyb:EGFP). The yellow boxes (enlarged views shown in the right side) denote Wdr5 signal colocalization in the cmyb+ HSPCs. Error bar, mean ± SD, ****P ≤ 0.0001. (Scale bar, 5 μm). (B) WISH (Left) and statistical data (Right) showing the expression of cmyb in the CHT region of siblings and wdr5 mutants at 2 dpf, 3 dpf, and 4 dpf. The black arrowheads denote cmyb+ HSPCs. Error bar, mean ± SD, ****P < 0.0001. (Scale bar, 100 μm). (C) Confocal imaging (Left) and statistical data (Right) showing cmyb+ HSPCs in the CHT region from siblings and wdr5 mutants with Tg(kdrl:mCherry;cmyb:EGFP) background at 2 dpf and 3 dpf. Error bar, mean ± SD, ****P ≤ 0.0001. (Scale bar, 20 μm). (D) qRT-PCR showing the expression of cmyb in the CHT region of siblings and wdr5 mutants at 2 dpf and 3 dpf. n = 3 replicates. Error bar, mean ± SD, *P = 0.0346, ****P = 0.0001. (E) TUNEL (Left) and statistical data (Right) showing the apoptotic cmyb+ cells (white arrowheads) in the CHT region from siblings and wdr5 mutants with Tg(cmyb:EGFP) background at 2 dpf. Error bar, mean ± SD, ****P ≤ 0.0001. (Scale bar, 50 μm). (F) qRT-PCR showing the expression of baxa, baxb, boxa, boxb, badb, bcl2a, and sival in the CD41+gata1− HSPCs from the CHT region of siblings and wdr5 mutants with Tg(CD41:GFP; gata1:dsRed) background at 2.5 dpf. Error bar, mean ± SD, *P ≤ 0.05, **P ≤ 0.01. |
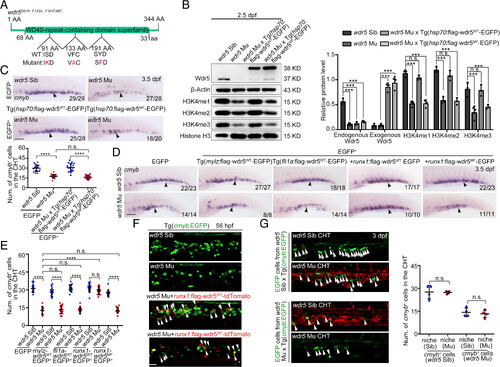
Wdr5-mediated H3K4 methylation regulates CHT HSPC development in a cell-autonomous manner. (A) The amino acids (in red) of zebrafish Wdr5 were mutated in order to generate Wdr5S91K, F133A, Y191F, which is abbreviated as Wdr5MF. (B) Western blotting (Left) and statistical data (Right) showing the protein level of wdr5 and the level of H3K4me1, H3K4me2, and H3K4me3 in the CHT region from siblings, wdr5 mutants, wdr5 mutant×Tg(hsp70:flag-wdr5WT-EGFP) and wdr5 mutant×Tg (hsp70:flag-wdr5MF-EGFP) at 2.5 dpf. wdr5WT and wdr5MF driven by hsp70 promoter was induced by heat shock at 28 hpf. Error bar, mean ± SD, n.s.: no significance, ***P ≤ 0.001. (C) WISH (up) and statistical data (down) showing the expression of cmyb (black arrowheads) in the CHT region of siblings, wdr5 mutants, wdr5 mutant×Tg(hsp70:flag-wdr5WT-EGFP) and wdr5 mutant×Tg(hsp70:flag-wdr5MF-EGFP) at 3.5 dpf. wdr5WT and wdr5MF driven by hsp70 promoter were induced by heat shock at 28 hpf. (Scale bar, 100 μm). Error bar, mean ± SD, n.s.: no significance, ****P ≤ 0.0001. (D) WISH showing the expression of cmyb (black arrowheads) in the CHT region of siblings, wdr5 mutants, wdr5 mutant×Tg(mylz:flag-wdr5WT-EGFP), wdr5 mutant×Tg(fli1a:flag-wdr5WT-EGFP) and wdr5 mutants injected with runx1:flag-wdr5WT-EGFP or runx1:flag-wdr5MF-EGFP plasmids at 3.5 dpf. (Scale bar, 100 μm). (E) Statistical data of the WISH (D). Error bar, mean ± SD, n.s.: no significance, ****P ≤ 0.0001. (F) Confocal imaging of cmyb+ HSPCs (white arrowheads) in the CHT region of siblings, wdr5 mutants, and wdr5 mutants injected with runx1:flag-wdr5WT-tdTomato or runx1:flag-wdr5MF-tdTomato plasmids at 56 hpf. (Scale bar, 50 μm). (G) Confocal imaging (Left) and statistical data (Right) of parabiosis generated between siblings or wdr5 mutants with Tg(cmyb:EGFP) or Tg(kdrl:mCherry) background. White arrowheads showing the cmyb:EGFP+ cells from siblings or wdr5 mutants in different niche (the CHT region in siblings and wdr5 mutants). Error bar, mean ± SD, n.s.: no significance. (Scale bar, 20 μm). |
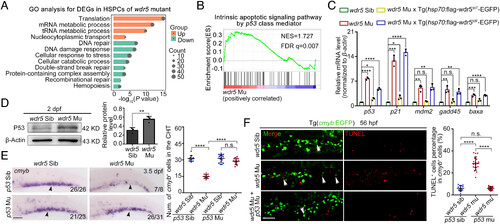
Apoptosis caused by wdr5 deletion is p53-dependent. (A) GO analysis for the downregulated genes in the CD41+gata1− HSPCs of CHT region from wdr5 mutant×Tg(CD41:GFP;gata1:dsRed), compared with that from siblings. (B) GSEA for the upregulated genes associated with the p53-involved signaling pathway in the CD41+gata1− HSPCs of CHT region from wdr5 mutant×Tg(CD41:GFP;gata1:dsRed) compared with that from siblings. (C) qRT-PCR showing the expression of p53, p21, mdm2, gadd45, and baxa in the CHT region of siblings, wdr5 mutants, wdr5 mutant×Tg(hsp70:flag-wdr5WT-EGFP) and wdr5 mutant×Tg(hsp70:flag-wdr5MF-EGFP) at 3.5 dpf. wdr5WT and wdr5MF driven by hsp70 promoter were induced by heat shock at 28 hpf. Error bar, mean ± SD, n.s.: no significance, *P ≤ 0.05, **P ≤ 0.01, ***P ≤ 0.001, ****P ≤ 0.0001. (D) Western blotting (Left) and statistical data (Right) showing the protein level of P53 in the CHT region of siblings and wdr5 mutants at 2 dpf. Error bar, mean ± SD, **P ≤ 0.01. (E) WISH (Left) and statistical data (Right) showing the expression of cmyb (black arrowheads) in the CHT region at 3.5 dpf. Error bar, mean ± SD, n.s.: no significance, ****P ≤ 0.0001. (Scale bar, 100 μm). (F) TUNEL (Left) and statistical data (Right) showing the apoptotic cmyb+ cells (white arrowheads) in the CHT region at 56 hpf. Error bar, mean ± SD, n.s.: no significance, ****P ≤ 0.0001. (Scale bar, 50 μm). |
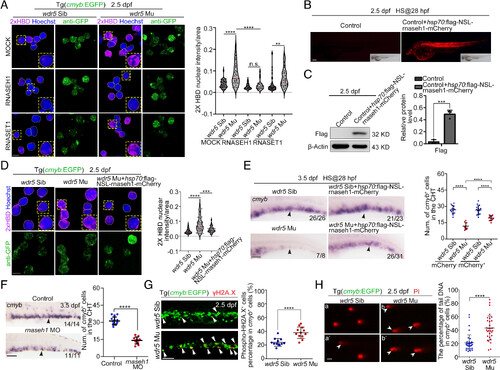
Wdr5 loss facilitates aberrant R-loops accumulation and further leads to DNA damage. (A) IF (Left) and statistical data (Right, n > 30) showing the signals of 2xHBD in HSPCs of siblings and wdr5 mutants with Tg(cmyb:EGFP) background. Cell smears were mock-treated or pretreated with RNase H1 and RNase T1 for 1 h at 37 °C after blocking, and prior to 2×HBD staining. Error bar, mean ± SD, n.s.: no significance, **P ≤ 0.01, ****P ≤ 0.0001. (Scale bar, 5 μm). (B) The imaging of mCherry fluorescence in control and embryos injected with hsp70:flag-rnaseh1-mCherry plasmids at 2.5 dpf. (Scale bar, 200 μm). (C) Western blotting (Left) and statistical data (Right) showing the level of Flag-Rnaseh1 protein in the CHT region of control and embryos injected with hsp70:flag-rnaseh1-mCherry plasmids at 2.5 dpf. rnaseh1 driven by hsp70 promoter were induced by heat shock at 28 hpf. Error bar, mean ± SD, ***P≤ 0.001. (D) IF (Left) and statistical data (Right, n > 32) showing the signals of 2×HBD in the HSPCs of siblings, wdr5 mutants, and wdr5 mutants injected with hsp70:flag-rnaseh1-mCherry plasmids at 2.5 dpf. Error bar, mean ± SD, ***P ≤ 0.001, ****P ≤ 0.0001. (Scale bar, 5 μm). (E) WISH (Left) and statistical data (Right) showing the expression of cmyb (black arrowheads) in the CHT region of siblings, wdr5 mutants, siblings injected with hsp70:flag-rnaseh1-mCherry plasmids and wdr5 mutants injected with hsp70:flag-rnaseh1-mCherry plasmids at 3.5 dpf. Error bar, mean ± SD, ****P ≤ 0.0001. (Scale bar, 100 μm). (F) WISH (Left) and statistical data (Right) showing the expression of cmyb (black arrowheads) in the control embryos and rnaseh1 morphants at 3.5 dpf. Error bar, mean ± SD, ****P ≤ 0.0001 (Scale bar, 100 μm). (G) IF (Left) and statistical data (Right) showing the signals of γH2AX (white arrowheads) in the CHT region of siblings and wdr5 mutants with Tg(cmyb:EGFP) background at 2.5 dpf. Error bar, mean ± SD, ****P ≤ 0.0001. (Scale bar, 50 μm). (H) Alkaline comet assay (Left) and statistical data (Right) showing the level of DNA damage in cmyb+ cells (white arrowheads) in the CHT region of siblings and wdr5 mutants with Tg(cmyb:EGFP) background at 2.5 dpf. Error bar, mean ± SD, ****P ≤ 0.0001. (Scale bar, 20 μm). |
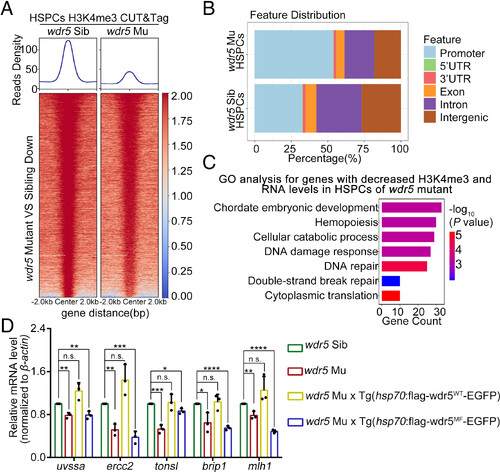
Wdr5-mediated H3K4me3 maintains the expression of DNA repair genes in the CHT HSPCs. (A) Profile plots of H3K4me3 enrichment at promoter-marked regions and heatmap of H3K4me3 enrichment surrounding gene promoters in the CD41+gata1− HSPCs of CHT region from siblings and wdr5 mutants. (B) Bar plot showing the genomic distribution of H3K4me3 peaks in the CD41+gata1− HSPCs of CHT region from siblings and wdr5 mutants. (C) GO analysis for genes with reduced H3K4me3 peaks and expression level in the CD41+gata1− HSPCs of CHT region from wdr5 mutants. (D) qRT-PCR showing the expression of uvssa, ercc2, tonsl, brip1, and mlh1 in the CHT region of siblings, wdr5 mutants, wdr5 mutant× Tg(hsp70:flag-wdr5WT-EGFP) and wdr5 mutant× Tg(hsp70:flag-wdr5MF-EGFP) embryos at 3.5 dpf. wdr5WT and wdr5MF driven by hsp70 promoter were induced by heat shock at 28 hpf. Error bar, mean ± SD, n.s.: no significance, *P ≤ 0.05, **P ≤ 0.01, ***P ≤ 0.001, ****P ≤ 0.0001. |
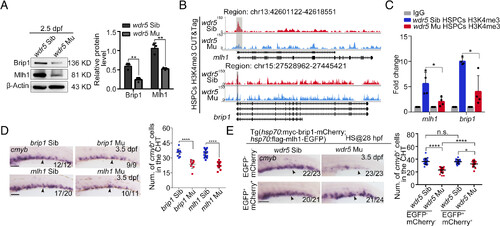
H3K4me3 regulates mlh1 and brip1 expression to maintain CHT HSPC development. (A) Western blotting (Left) and statistical data (Right) showing the protein level of Brip1 and Mlh1 in the CHT region of siblings and wdr5 mutants at 2.5 dpf. Error bar, mean ± SD, **P ≤ 0.01. (B) Genome browser view showing the enrichment of H3K4me3 at putative regulatory elements of mlh1 and brip1 in the CD41+gata1− HSPCs of sibling and wdr5 mutants. (C) H3K4me3 CUT&Tag qPCR showing the relative enrichment levels of H3K4me3 at the mlh1 and brip1 promoter in HSPCs in the CHT region of siblings and wdr5 mutants at 2.5 dpf. Error bar, mean ± SD, *P ≤ 0.05. (D) WISH (Left) and statistical data (Right) showing the expression of cmyb (black arrowheads) in brip1 siblings, brip1 mutants, mlh1 siblings, and mlh1 mutants. Error bar, mean ± SD, ****P ≤ 0.0001. (Scale bar, 100 μm). (E) WISH (Left) and statistical data (Right) showing the expression of cmyb (black arrowheads) in siblings, wdr5 mutants, sibling×Tg(hsp:flag-mlh1-EGFP; hsp:myc-brip1-mCherry) and wdr5 mutant×Tg(hsp:flag-mlh1-EGFP; hsp:myc-brip1-mCherry). mlh1 and brip1 driven by hsp70 promoter were induced by heat shock at 28 hpf. Error bar, mean ± SD, n.s.: no significance, *P ≤ 0.05, ****P ≤ 0.0001. (Scale bar, 100 μm). |