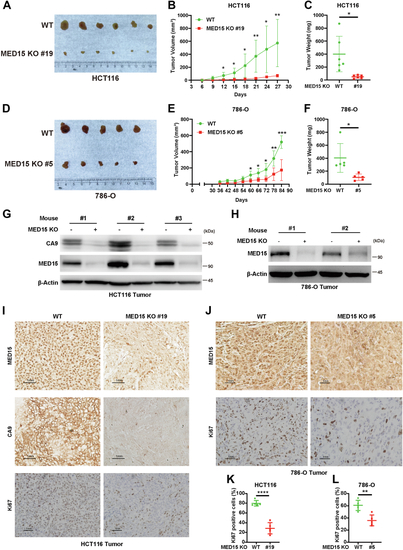
Knockout of MED15 suppresses tumor growth in vivo.A–C, WT and MED15 KO (KO #19) HCT116 cells were transplanted into the armpits of nude mice, and tumor volume was measured every 3 days. Tumor image (A), growth curves (B), and weight (C) are shown (n = 6). Data are represented as means ± SD. ∗p < 0.05, ∗∗p < 0.01 by Student's t test. D–F, WT and MED15 KO (KO #5) 786-O cells were transplanted into the armpits of nude mice, and tumor volume was measured every six days starting from the 36th day. Tumor image (D), growth curves (E), and weight (F) are shown (n = 5). Data are represented as means ± SD. ∗p < 0.05, ∗∗p < 0.01, ∗∗∗p < 0.001 by Student's t test. G, protein levels of MED15 and CA9 were determined by Western blot using the lysates from six independent tumors in (A). H, protein levels of MED15 were determined by Western blot using the lysates from four independent tumors of (D). I, representative IHC images of MED15, CA9, and Ki67 using the paraffin section of tumors in (A) are shown. J, representative IHC images of MED15 and Ki67 using the paraffin section of tumors in (D) are shown. K and L, Ki67-positive cells were counted from the images in (I) (n = 5) and (J) (n = 5). Data are represented as means ± SD. ∗∗p < 0.01, ∗∗∗∗p < 0.0001 by Student's t test. CA9, carbonic anhydrase 9; Ki67, proliferation marker protein Ki-67; MED15, Mediator complex subunit 15.
|
