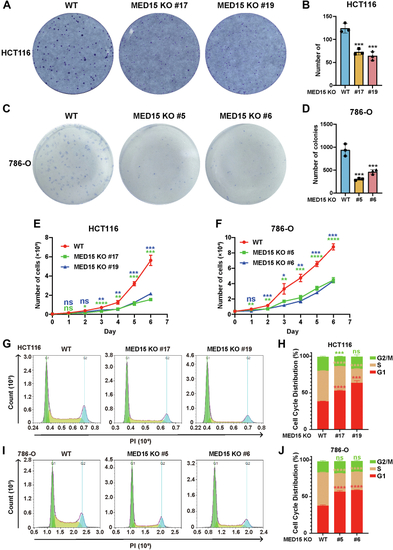
MED15 depletion suppresses the proliferation of tumor cells in vitro.A–D, colony formation assay of WT and MED15 KO HCT116 cells (KO #17, KO #19) and 786-O cells (KO #5, KO #6). Cells were cultured for 9 days. Representative images from three independent experiments are shown in (A and C). Quantification of colony numbers is shown in (B and D). Data are represented as means ± SD. n = 3 biologically independent repeats. ∗∗∗p < 0.001 by one-way ANOVA with Sidak's t test. E and F, cell proliferation curves of WT and MED15 KO HCT116 cells (KO #17, KO #19) and 786-O cells (KO #5, KO #6). Cell numbers were determined by cell counter. Data are represented as means ± SD. n = 3 biologically independent extracts. ∗p < 0.05, ∗∗p < 0.01, ∗∗∗p < 0.001, ∗∗∗∗p < 0.0001 by one-way ANOVA with Sidak's t test. G–J, flow cytometry analysis of cell cycle distribution in WT and MED15 KO HCT116 cells (KO #17, KO #19) and 786-O cells (KO #5, KO #6). Representative images from three independent experiments are shown in (G and I). Statistics of cell cycle distribution are shown in (H and J). Data are represented as means ± SD. n = 3 biologically independent extracts. ∗∗∗p < 0.001, ∗∗∗∗p < 0.0001 by one-way ANOVA with Sidak's t test. ns, not significant; MED15, Mediator complex subunit 15.
|
