FIGURE SUMMARY
Title

The mediator subunit complex protein MED15 promotes lipid deposition and cancer progression during hypoxia

Authors
Zhang, B., Zhu, Y., Tang, Y., Liu, L., Liu, Y., Li, Y., Yu, W., Lu, L.
Source
Full text @ J. Biol. Chem.

MED15 positively regulates HIF transcriptional activity.A and B, expression levels of HIF target genes in clinical cancer samples from the TCGA cohorts in the MED15 low expression group (bottom 25%) and high expression group (top 25%) are shown. ∗∗∗∗p < 0.0001 by Student's t test. CE, luciferase reporter assays in HCT116 cells exposed to 21% O2 or 1% O2 for 24 h (C) or transfected with empty vector (EV), HIF1α (D), or HIF2α (E). The Firefly luciferase activity was normalized to the Renilla luciferase activity. Data are represented as means ± SD. n = 3 biologically independent extracts. ∗p < 0.05, ∗∗p < 0.01, ∗∗∗∗p < 0.0001 by two-way ANOVA with Tukey's multiple comparisons test. F, RT-qPCR analysis of CA9, LDHA, and REDD1 in WT or MED15 KO (KO #17, KO #19) HCT116 cells exposed to 21% O2 or 1% O2 for 24 h. Data are represented as means ± SD. n = 3 biologically independent extracts. ∗p < 0.05, ∗∗∗∗p < 0.0001 by two-way ANOVA with Tukey's multiple comparisons test. G, Western blot of HIF1α, HIF2α, and CA9 in HCT116 WT or MED15 KO cells exposed to 21% O2 or 1% O2 for 24 h. H, Western blot of HIF2α in 786-O WT or MED15 KO cells. I, Western blot of HIF1α and HIF2α in HCT116 cells transfected with EV or HIS-tagged MED15. Cells were exposed to 21% O2 or 1% O2 for 24 h. CA9, carbonic anhydrase 9; COADREAD, Colon adenocarcinoma/Rectum adenocarcinoma Esophageal carcinoma; HIF, hypoxia-inducible factor; KIPAN, Pan-kidney cohort; LDHA, lactate dehydrogenase A; MED15, Mediator complex subunit 15; ns, not significant; REDD1, protein regulated in development and DNA damage response 1.

Disruption of med15 in zebrafish suppresses hypoxia signaling.A, information for constructing med15-deficient zebrafish using CRISPR/Cas9 system. B, RT-qPCR analysis of the mRNA levels of med15 in WT or med15-deficient (med15ouc1) zebrafish larvae (3 dpf). Data are represented as means ± SD. n = 3 biologically independent extracts. ∗∗∗∗p < 0.0001 by Student's t test. CH, RT-qPCR analysis of cited2 (C), phd3 (D), runx1 (E), redd1 (F), gadd34 (G), and epo (H) mRNA levels in WT or med15-deficient (med15ouc1) zebrafish larvae (3 dpf) under normoxia (21% O2) or hypoxia (6% O2) for 10 h. Data are represented as means ± SD. n = 3 biologically independent extracts. ∗∗p < 0.01, ∗∗∗∗p < 0.0001 by two-way ANOVA with Tukey's multiple comparisons test. I, Kaplan-Meier survival analysis for WT (n = 8) and med15-null (n = 8) adult zebrafish under 5% hypoxia conditions by log rank test. cited2, CBP/p300-interacting transactivator 2; epo, erythropoietin; gadd34, growth arrest and DNA damage-inducible protein 34; HR, hazard ratio; ns, not significant; med15, Mediator complex subunit 15; phd3, prolyl hydroxylase; redd1, protein regulated in development and DNA damage response 1; runx1, runt-related transcription factor 1.

MED15 is a HIF target gene.A, HCT116 cells were exposed to either 21% O2 or 1% O2 for 24 h. RNA sequencing was performed to analyze the transcript levels of Mediator complex subunits. B, HCT116 cells were exposed to 21% O2 or 1% O2 for 24 h, and Western blot assay was performed with indicated antibodies. C, correlations analysis of MED15 and HIF1α mRNA levels in cancer samples from TCGA is shown. The sample correlation coefficient (R) and corresponding p values are indicated. D, RT-qPCR analysis of MED15 mRNA levels in HCT116 cells exposed to 21% O2 or 1% O2 for 24 h. Data are represented as means ± SD. n = 3 biologically independent extracts. ∗∗∗p < 0.001 by Student's t test. E, HCT116 cells were exposed to 1% O2 for the indicated times, or transfected with HIF1α expression vector, or treated with CoCl2. Western blot analysis was then performed to evaluate MED15 protein levels. F, Western blot of MED15 protein in HCT116 cells transfected with empty vector or HIF2α expression vector. G, diagram of the MED15 promoter region (6000 base pairs upstream to 1500 base pairs downstream of the transcriptional start site (+1), NCBI reference sequence NC_000022.11: 20501610-20509109) analyzed for potential HREs. H, luciferase assay in HCT116 cells cotransfected with pSV40-Renilla and p2.1, different pGL2 HREs, or pGL2 -3000 ∼ +1 region and then exposed to 21% O2 or 1% O2 for 24 h. The Firefly luciferase activity was normalized to the Renilla luciferase activity. Data are represented as means ± SD. n = 3 biologically independent extracts. ∗∗∗∗p < 0.0001 by Student's t test. I, diagram of pGL2 site8 and pGL2 site8-MUT. J, luciferase assay in HCT116 cells cotransfected with pSV40-Renilla and pGL2 site8 or pGL2 site8-MUT and then exposed to 21% O2 or 1% O2 for 24 h. The Firefly luciferase activity was normalized to the Renilla luciferase activity. Data are represented as means ± SD. n = 3 biologically independent extracts. ∗∗∗∗p < 0.0001 by Student's t test. HIF, hypoxia-inducible factor; MED15, Mediator complex subunit 15; MUT, mutant; ns, not significant.

MED15 depletion suppresses the proliferation of tumor cells in vitro.AD, colony formation assay of WT and MED15 KO HCT116 cells (KO #17, KO #19) and 786-O cells (KO #5, KO #6). Cells were cultured for 9 days. Representative images from three independent experiments are shown in (A and C). Quantification of colony numbers is shown in (B and D). Data are represented as means ± SD. n = 3 biologically independent repeats. ∗∗∗p < 0.001 by one-way ANOVA with Sidak's t test. E and F, cell proliferation curves of WT and MED15 KO HCT116 cells (KO #17, KO #19) and 786-O cells (KO #5, KO #6). Cell numbers were determined by cell counter. Data are represented as means ± SD. n = 3 biologically independent extracts. ∗p < 0.05, ∗∗p < 0.01, ∗∗∗p < 0.001, ∗∗∗∗p < 0.0001 by one-way ANOVA with Sidak's t test. GJ, flow cytometry analysis of cell cycle distribution in WT and MED15 KO HCT116 cells (KO #17, KO #19) and 786-O cells (KO #5, KO #6). Representative images from three independent experiments are shown in (G and I). Statistics of cell cycle distribution are shown in (H and J). Data are represented as means ± SD. n = 3 biologically independent extracts. ∗∗∗p < 0.001, ∗∗∗∗p < 0.0001 by one-way ANOVA with Sidak's t test. ns, not significant; MED15, Mediator complex subunit 15.

Knockout of MED15 suppresses tumor growth in vivo.AC, WT and MED15 KO (KO #19) HCT116 cells were transplanted into the armpits of nude mice, and tumor volume was measured every 3 days. Tumor image (A), growth curves (B), and weight (C) are shown (n = 6). Data are represented as means ± SD. ∗p < 0.05, ∗∗p < 0.01 by Student's t test. DF, WT and MED15 KO (KO #5) 786-O cells were transplanted into the armpits of nude mice, and tumor volume was measured every six days starting from the 36th day. Tumor image (D), growth curves (E), and weight (F) are shown (n = 5). Data are represented as means ± SD. ∗p < 0.05, ∗∗p < 0.01, ∗∗∗p < 0.001 by Student's t test. G, protein levels of MED15 and CA9 were determined by Western blot using the lysates from six independent tumors in (A). H, protein levels of MED15 were determined by Western blot using the lysates from four independent tumors of (D). I, representative IHC images of MED15, CA9, and Ki67 using the paraffin section of tumors in (A) are shown. J, representative IHC images of MED15 and Ki67 using the paraffin section of tumors in (D) are shown. K and L, Ki67-positive cells were counted from the images in (I) (n = 5) and (J) (n = 5). Data are represented as means ± SD. ∗∗p < 0.01, ∗∗∗∗p < 0.0001 by Student's t test. CA9, carbonic anhydrase 9; Ki67, proliferation marker protein Ki-67; MED15, Mediator complex subunit 15.

Loss of MED15 suppresses HIF-induced lipid droplet accumulation.A and B, Nile Red and DAPI staining assay of WT and MED15 KO (KO #19) HCT116 cells under normoxia (21% O2) or hypoxia (1% O2) for 72 h. Representative images from three independent experiments are shown in (A). Quantification of Nile Red staining area is shown in (B). Data are represented as means ± SD. n = 27 (21% O2 WT); 25 (21% O2 MED15 KO #19); 26 (1% O2 WT); 30 (1% O2 MED15 KO #19). ∗∗∗p < 0.01, ∗∗∗∗p < 0.0001 by two-way ANOVA with Tukey's multiple comparisons test. C and D, Nile Red and DAPI staining assay of WT and MED15 KO (KO #5) 786-O cells. Representative images from three independent experiments are shown in (C). Quantification of Nile Red staining area is shown in (D). Data are represented as means ± SD. n = 21 (WT); 20 (MED15 KO #5). ∗∗∗∗p < 0.0001 by Student's t test. HIF, hypoxia-inducible factor; med15, Mediator complex subunit 15.

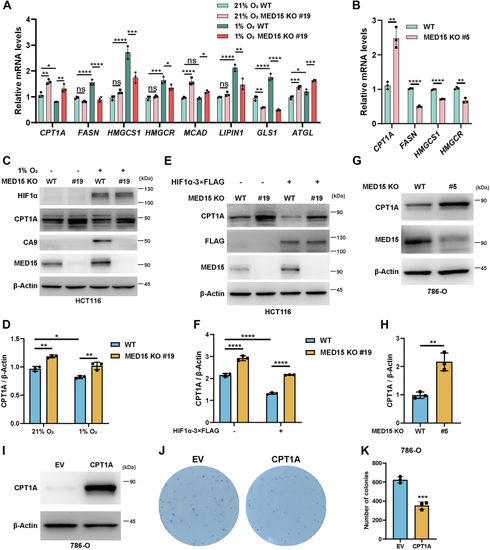
Knocking out MED15 activates the expression of CPT1A.A, RT-qPCR analysis of the mRNA levels of CPT1A, FASN, HMGCS1, HMGCR, MCAD, LIPIN1, GLS1, and ATGL in WT or MED15 KO (KO #19) HCT116 cells exposed to 21% O2 or 1% O2 for 72 h. Data are represented as means ± SD. n = 3 biologically independent extracts. ∗p < 0.05, ∗∗p < 0.01, ∗∗∗p < 0.0001, ∗∗∗∗p < 0.0001 by two-way ANOVA with Tukey's multiple comparisons test. B, RT-qPCR analysis of the the mRNA levels of CPT1A, FASN, HMGCS1, and HMGCR in WT or MED15 KO (KO #5) 786-O cells. Data are represented as means ± SD. n = 3 biologically independent extracts. ∗∗p < 0.01, ∗∗∗∗p < 0.0001 by Student's t test. C and D, Western blot of indicated proteins in WT or MED15 KO (KO #19) HCT116 cells exposed to 21% O2 or 1% O2 for 72 h (C). Relative intensities of CPT1A were quantified (D). Data are represented as means ± SD. n = 3 biologically independent extracts. ∗p < 0.05, ∗∗p < 0.01 by two-way ANOVA with Tukey's multiple comparisons test. E and F, Western blot of indicated proteins in WT or MED15 KO (KO #19) HCT116 cells transfected with EV (−) or HIF1α-3 × FLAG (+) (E). Relative intensities of CPT1A were quantified (F). Data are represented as means ± SD. n = 3 biologically independent extracts. ∗∗∗∗p < 0.0001 by two-way ANOVA with Tukey's multiple comparisons test. G and H, Western blot of indicated proteins in WT or MED15 KO (KO #5) 786-O cells (G). Relative intensities of CPT1A were quantified (H). Data are represented as means ± SD. n = 3 biologically independent extracts. ∗∗p < 0.01 by Student's t test. I, Western blot assay of CPT1A confirmed that CPT1A protein level significantly upregulated after stable overexpression of CPT1A. J and K, colony formation assay of 786-O with stable overexpression of EV or CPT1A. Cells were cultured for 9 days. Representative images from three independent experiments are shown in (J). Quantification of colony numbers is shown in (K). Data are represented as means ± SD. n = 3 biologically independent repeats. ∗∗∗p < 0.001 by Student's t test. ATGL, adipose triglyceride lipase; CPT1A, carnitine palmitoyltransferase 1A; FASN, fatty acid synthase; EV, empty vector; GLS1, glutaminase 1; HIF, hypoxia-inducible factor; HMGCS1, 3-hydroxy-3-methylglutaryl-CoA synthase 1; HMGCR, 3hydroxy-3methylglutaryl-coenzyme A reductase; MCAD, medium-chain specific acyl-CoA dehydrogenase; MED15, Mediator complex subunit 15; ns, not significant.

Inhibiting CPT1A can rescue MED15 deficiency–dependent lipid droplet reduction.A and B, WT and MED15 KO HCT116 cells were exposed to 21% O2 or 1% O2 for 72 h in the presence of DMSO or Etomoxir (2.5 μM). LD and nuclei were staining with Nile Red and DAPI. Representative images from three independent experiments are shown in (A). Quantification of Nile Red staining area is shown in (B). Data are represented as means ± SD. n = 19 (21% O2 WT DMSO); 18 (21% O2 WT Etomoxir); 20 (21% O2 MED15 KO #19 DMSO); 20 (21% O2 MED15 KO #19 Etomoxir); 21 (1% O2 WT DMSO); 19 (1% O2 WT Etomoxir); 21 (1% O2 MED15 KO #19 DMSO); 19 (1% O2 MED15 KO #19 Etomoxir). ∗p < 0.05, ∗∗∗p < 0.001, ∗∗∗∗p < 0.0001 by two-way ANOVA with Tukey's multiple comparisons test. C and D, Nile Red and DAPI staining of WT and MED15 knockout 786-O treated with DMSO or Etomoxir (2.5 μM) for 72 h. Representative images from three independent experiments are shown in (C). Quantification of Nile Red staining area is shown in (D). Data are represented as means ± SD. n = 20 (WT DMSO); 20 (MED15 KO #5 DMSO); 20 (WT Etomoxir); 20 (MED15 KO #5 Etomoxir); ∗∗∗∗p < 0.0001 by two-way ANOVA with Tukey's multiple comparisons test. MED15, Mediator complex subunit 15; ns, not significant.

MED15 deficiency inhibits the TAD function of HIF1α and the binding of HIF1α to HRE.A, schematic diagram of Gal4/UAS reporting system. The DNA-binding domain of Gal4 (Gal4-DBD) and transcriptional activation domain of HIF1α (HIF1α-TAD) are fused and expressed. B, luciferase reporter assays in WT or MED15 KO (KO #19) HCT116 cells. Cells were cotransfected with GalO or GalA, pSV40-Renilla, and reporter plasmid (pGal4-UAS-Elb-FLuc), followed by being exposed to 21% O2 or 1% O2 for 24 h. Data are represented as means ± SD. n = 3 biologically independent extracts. ∗∗∗∗p < 0.0001 by two-way ANOVA with Tukey's multiple comparisons test. CF, Cut&Run analysis in WT or MED15 KO (KO #19) HCT116 cells. Cells were exposed to 1% O2 for 24 h. Cut&Run assays were performed with antibody against IgG or HIF1α followed by qPCR analysis of HRE enrichment multiples of HIF target genes CA9 (C), PKM (D), VEGFA (E), and CPT1A (F). Data are represented as means ± SD. n = 3 biologically independent extracts. ∗∗p < 0.01, ∗∗∗p < 0.001, ∗∗∗∗p < 0.0001 by two-way ANOVA with Tukey's multiple comparisons test. CA9, carbonic anhydrase 9; CPT1A, carnitine O-palmitoyltransferase 1; E1b, a TATA box from the promoter region of adenovirus E1b gene; Gal4-UAS, Gal4 binding DNA sequence; HIF, hypoxia-inducible factor; MED15, Mediator complex subunit 15; ns, not significant; PKM, pyruvate kinase; VEGFA, vascular endothelial growth factor A.

MED15–HIF–CPT1A axis maintains lipid homeostasis and promotes tumor progression. The proposed model suggests that MED15 promotes cancer progression during hypoxia. In hypoxia, stabilized HIFα forms a dimeric complex with HIFβ and binds to the HRE of MED15. MED15 acts as a transcriptional coactivator of HIF, facilitating its binding to the promoter of CPT1A. Due to its role as a HIF-repressed gene, CPT1A protein levels decrease, leading to increased storage of fatty acids in the cytoplasm as LD, thereby promoting tumor progression. CPT1A, carnitine O-palmitoyltransferase 1; HIF, hypoxia-inducible factor; MED15, Mediator complex subunit 15.

Acknowledgments
This image is the copyrighted work of the attributed author or publisher, and ZFIN has permission only to display this image to its users. Additional permissions should be obtained from the applicable author or publisher of the image. Full text @ J. Biol. Chem.