
Fig. 7
- ID
- ZDB-FIG-241119-16
- Publication
- Hoshino et al., 2024 - Pharmacological Inhibition of the Spliceosome SF3b Complex by Pladienolide-B Elicits Craniofacial Developmental Defects in Mouse and Zebrafish
- Other Figures
- All Figure Page
- Back to All Figure Page
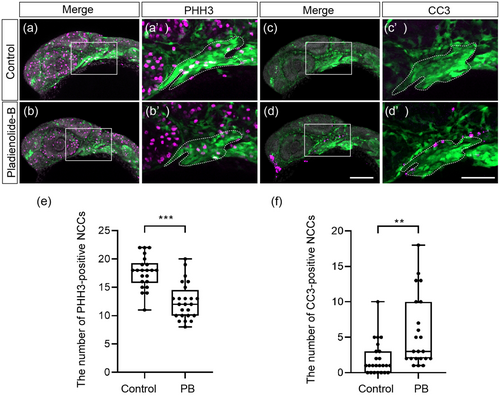
Mitosis and apoptosis in migratory CNCCs and CNCCs in PB-treated embryos at 24 hpf. (a–b′) Immunofluorescence images of mitotic ability of CNCCs. Samples were stained with anti-GFP antibody and anti-PHH3 antibody. (a′, b′) Magnified view of the rectangle in the panels (a) and (b). Green and magenta represent represents CNCCs and mitotic cells, respectively. The PA1 is defined by dashed line. (c–d′) Immunofluorescence images of apoptosis in CNCCs. Samples were stained with anti-GFP antibody and anti-CC3 antibody. (c′, d′) Magnified view of the rectangle in the panels (c) and (d). Green and magenta represent CNCCs and apoptotic CNNCs, respectively. n = 22 (control), n = 22 (PB 200 nM). (e) Quantification of the number of PHH3-positive migratory CNCCs and CNCCs in the PA1. (f) Quantification of the number of CC3-positive migratory CNCCs and CNCCs in the PA1. ***: p < 0.001 (one-way ANOVA followed by Dunnett's multiple comparison test). Scale bars: 100 μm (a–d), 50 μm (a′–d′). The dots in (e) and (f) represent individual embryos examined. All experiments were performed in three biological replicates. |