
Fig. 1
- ID
- ZDB-FIG-241119-10
- Publication
- Hoshino et al., 2024 - Pharmacological Inhibition of the Spliceosome SF3b Complex by Pladienolide-B Elicits Craniofacial Developmental Defects in Mouse and Zebrafish
- Other Figures
- All Figure Page
- Back to All Figure Page
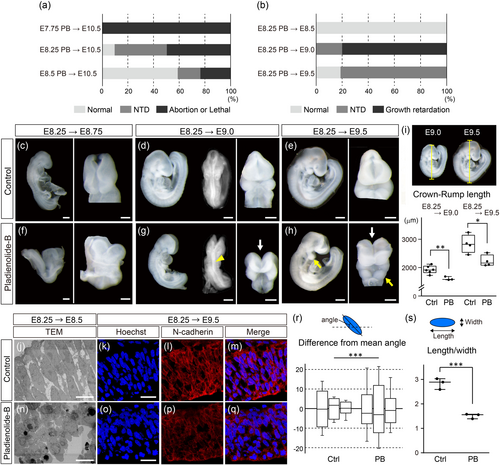
Phenotype of wild-type embryos exposed to Pladienolide-B (PB). (a) Ratio of different phenotypes observed in PB-exposed wild-type (ICR) embryos at E10.5. Phenotypes of embryos exposed to PB at E7.75 (top, n = 22), at E8.25 (middle, n = 16), and at E8.5 (bottom, n = 17). For all experiments, embryos were obtained from at least two pregnant mice. (b) Ratio of phenotypes in wild-type (C57BL/6J) embryos exposed to PB at E8.25. Phenotype of PB-exposed embryos examined at E8.5 (top, n = 14), at E9.0 (middle, n = 20), and at E9.5 (bottom, n = 16). For all experiments, embryos were obtained from at least two pregnant mice. (c–h) Comparison of control embryos (c–e) and embryos exposed to PB at E8.25 (f–h), assessed at E8.75 (c, f), E9.0 (d, g), and E9.5 (e, h). White arrows in (g) and (h) show NTD in the forebrain and hidbrain. Yellow arrowhead in (g) and yellow arrow in (h) indicates the neural tube and the PA1, respectively. (i) Crown-rump length of control embryos and embryos exposed to PB at E8.25, evaluated at E9.0 (left) and E9.5 (right). The dots represent individual embryos obtained from two pregnant mice. (j, n) Transmission Electron Microscopy (TEM) analysis of the neuroepithelium at E8.5 of control embryos (j) and embryos exposed to PB at E8.25 (n). (k–m, o–q) Immunofluorescence imaging of E9.5 neuroepithelium in control embryos (k–m) and embryos exposed to PB at E8.25 (o–q). Hoechst nuclear (k, o) and N-cadherin staining (l, p), and merge (m, q) images are shown. For fluorescent staining experiment, n = 3 obtained from two control pregnant mice (k–m) or n = 4 obtained from three PB-exposed pregnant mice (o–q). Only one sample was examined for TEM analysis, and consistent results as immunostaining were obtained. (r) An illustration showing the method for measuring the angle of the cell nucleus. The angle of the long axis of the nucleus (blue oval) in the neuroepithelium were measured, and the mean angle for each individual was calculated. The difference between the angle of each cell and the mean angle was measured. (n = 3, rectangle bars, obtained from two pregnant mice. 15–20 nuclei were examined in each embryo). (s) The length-to-width ratio of the nucleus (blue oval) in the neuroepithelium was calculated. The dots represent individual embryos obtained from two control or two PB-exposed pregnant mice. *: p < 0.05, **: p < 0.01, ***p < 0.001 (Student's t-test, F-test). Scale bar: 200 μm for (c, f), 400 μm for (d, e, g, h), 10 μm for (j, n), and 20 μm for (k, o). |