
Fig. 3
- ID
- ZDB-FIG-241119-12
- Publication
- Hoshino et al., 2024 - Pharmacological Inhibition of the Spliceosome SF3b Complex by Pladienolide-B Elicits Craniofacial Developmental Defects in Mouse and Zebrafish
- Other Figures
- All Figure Page
- Back to All Figure Page
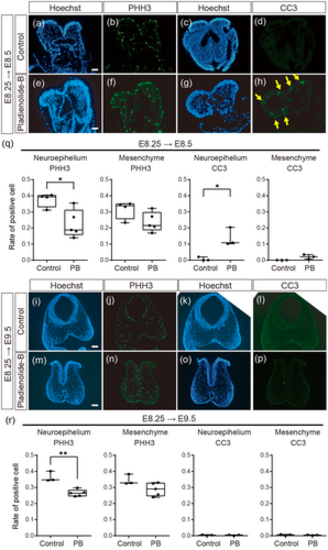
Immunohistochemistry of PHH3 and CC3 in wild-type embryos. (a–d) Frontal sections of control embryos at E8.5 and (e–h) frontal sections of E8.5 embryos exposed to PB at E8.25. (a, c, e, g) Hoechest, (b, f) PHH3, and (d, h) CC3 immunofluorescent signals. (i–l) Frontal sections of control embryos at E9.5 and (m–p) and frontal sections of E9.5 embryos exposed to PB at E8.25. (i, k, m, o) Hoechest, (j, n) PHH3, and (l, p) CC3 immunofluorescent signals. n = 3 for each experiment in (a–h) and (i–p). (q, r) Ratio of PHH3 and CC3 positive cells in the neuroepithelium and mesenchyme in E8.5 (q) or E9.5 (r) embryos of control and PB-exposed at E8.25. For (q) and (r), the cell rates were calculated by the positive cell number per nucleus number in the same area. The dots in (q) and (r) represent individual embryos obtained from at least two control or two PB-treated pregnant mice. *: p < 0.05, **: p < 0.01 (Student's t-test). Scale bar: 50 μm for (a, e) and 100 μm for (i, m). |