
Fig. 6
- ID
- ZDB-FIG-240812-6
- Publication
- Gioacchino et al., 2024 - GATA2 heterozygosity causes an epigenetic feedback mechanism resulting in myeloid and erythroid dysplasia
- Other Figures
- All Figure Page
- Back to All Figure Page
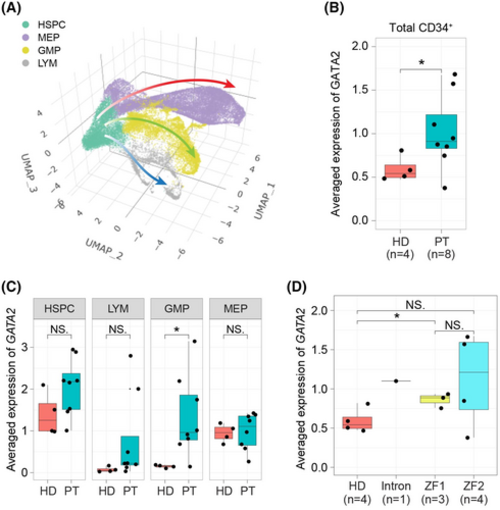
CD34+ cells from germline GATA2 mutation patients show increased mRNA levels of GATA2 compared to healthy donors. (A) Three-dimensional (3D) uniform manifold approximation and projection (UMAP) atlas of single-cell data from public human dataset (GSE135194). Each dot represents a cell and the colour indicates the cell type. (B) Box plot showing the distinct expression level of GATA2 between healthy donors and patients. Each dot indicates one individual sample. t Test was used to calculate p value. (C) Box plot showing the distinct expression level of GATA2 in different cell types between healthy donors and patients. Each dot indicates one individual sample. t Test was used to calculate p value. (D) Box plot showing the distinct expression level of GATA2 between healthy donors and patient samples separated by the various mutation locations. Note that ZF1 mutations are frameshift truncating mutations. Each dot indicates one individual sample. t Test was used to calculate p value. NS, not significant; *p < 0.05. |