
Fig. 4
- ID
- ZDB-FIG-240812-4
- Publication
- Gioacchino et al., 2024 - GATA2 heterozygosity causes an epigenetic feedback mechanism resulting in myeloid and erythroid dysplasia
- Other Figures
- All Figure Page
- Back to All Figure Page
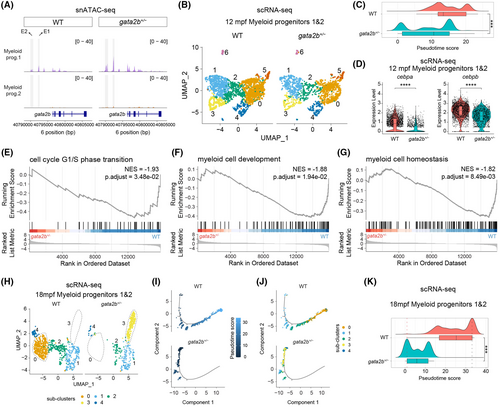
Heterozygous gata2b results in myeloid differentiation delay. (A) Coverage plots showing the gata2b chromatin accessibility between wild-type (WT) and gata2b+/− ‘myeloid progenitors 1’ and ‘myeloid progenitors 2’ with the location of the gata2b gene block shown in blue. The normalized peak signal range is 0–40. Highlighted genomic regions within grey blocks indicate the location of two putative enhancers, enhancer 1 (E1) and enhancer 2 (E2). (B) Uniform manifold approximation and projection (UMAP) analysis of ‘myeloid progenitors 1’ and ‘myeloid progenitors 2’ showing the subclusters distribution in 12 months postfertilization (mpf) scRNA-seq. UMAP atlas was separated between WT and gata2b+/− cells. (C) Ridge chart showing the distribution of myeloid progenitor cells along the pseudotime trajectory as shown in Figure S7B. Ridge curves indicate the cell density after ordering by pseudotime score. Box chart shows the statistical pseudotime score analysis between WT and gata2b+/− myeloid progenitor cells, and t test was used to calculate p value. (D) Violin plot displaying the quantification and statistics of cebpa and cebpb mRNA levels in myeloid progenitor cells between WT and gata2b+/− in 12 mpf scRNA-seq. t Test was used to calculate p value. (E–G) Several down-regulated pathways in 12mpf gata2b+/− myeloid progenitor cells in scRNA-seq. NES, normalized enrichment score. (H) UMAP analysis of ‘myeloid progenitors 1’ and ‘myeloid progenitors 2’ showing the subclusters distribution in 18 mpf scRNA-seq. UMAP atlas was separated between WT and gata2b+/− cells. (I, J) Pseudotime trajectory of myeloid progenitor cells in 18 mpf scRNA-seq. (I) Shows the cells labelled by pseudotime scores, separating between WT and gata2b+/− cells. (J) Shows the cells labelled by subclusters as shown in (H). (K) Ridge chart showing the distribution of myeloid progenitor cells along with pseudotime trajectory, separating between WT and gata2b+/− cells. Ridge curves indicate the cell density after ordering by pseudotime score. Box chart showing the statistical pseudotime score analysis between WT and gata2b+/− myeloid progenitor cells, and t test was used to calculate p value. ***p < 0.001; ****p < 0.0001. |