
Fig. 2
- ID
- ZDB-FIG-240812-2
- Publication
- Gioacchino et al., 2024 - GATA2 heterozygosity causes an epigenetic feedback mechanism resulting in myeloid and erythroid dysplasia
- Other Figures
- All Figure Page
- Back to All Figure Page
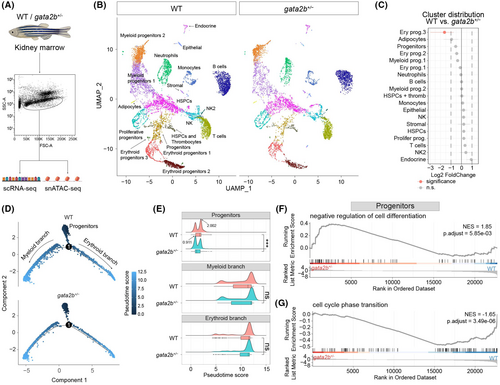
Single-cell transcriptome analysis reveals a differentiation delay in gata2b+/− HSPCs. (A) The flow cytometry-based sorting strategy for kidney marrow (KM) cells for single-cell RNA-sequencing (scRNA-seq) and single-nucleus ATAC-sequencing (snATAC-seq) analyses. (B) Uniform manifold approximation and projection (UMAP) analysis of scRNA-seq showing all 19 cell types. UMAP atlas was separated between wild-type (WT) and gata2b+/− cells. (C) Cluster distribution quantification of cell types in scRNA-seq between WT and gata2b+/− KM, with significantly differentially distributed clusters represented in pink. A statistical significance threshold of the false discovery rate <0.05 and absolute log2 fold change >1 were applied to determine the significance of the observed differences. (D) Pseudotime trajectories showing the developmental track of all progenitor cells involved in WT and gata2b+/− KM respectively. Arrows indicate the developmental direction. Dots represent cells labelled by pseudotime scores. Dark blue indicates lower pseudotime scores and light blue indicates higher pseudotime scores. (E) Ridge chart showing the cell distribution along the pseudotime trajectory. Ridge curves indicate the cell density after ordering by pseudotime score. Box charts show the statistical pseudotime score analysis of cells involved in each branch; t test was used to calculate p value. Black arrows indicate the pseusotime score of the highest peak point WT and gata2b+/− ‘progenitors’. ns, not significant; ***p < 0.001. (F, G) Gene set enrichment analysis (GSEA) of cells in ‘Progenitors’ clusters. (F) GSEA representing negative regulation of cell differentiation is up-regulated in the gata2b+/− ‘Progenitors’, and (G) GSEA representing cell cycle phase transition was down-regulated in the gata2b+/− ‘Progenitors’. NES, normalized enrichment score; p.adjuts, adjusted p value. |