
- Title
-
Elf1 Deficiency Impairs Macrophage Development in Zebrafish Model Organism
- Authors
- Tan, Q., Wang, J., Hao, Y., Yang, S., Cao, B., Pan, W., Cao, M.
- Source
- Full text @ Int. J. Mol. Sci.
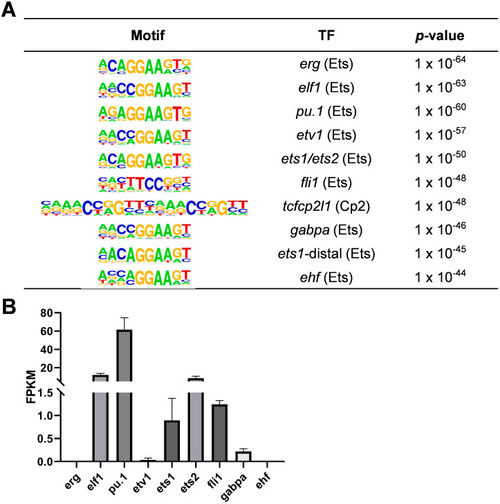
Transcription factor analysis of zebrafish macrophages via ATAC-seq and RNA-seq. ( |
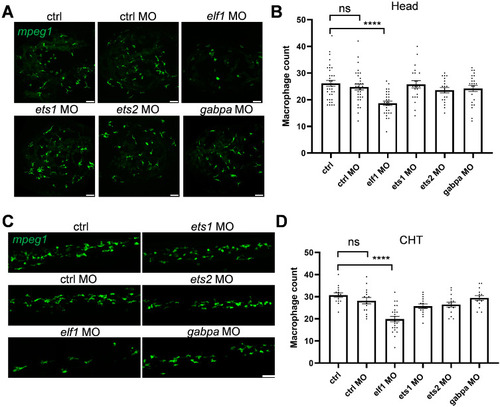
Morpholino knockdown-mediated screening of Ets family members in zebrafish macrophage development. ( |
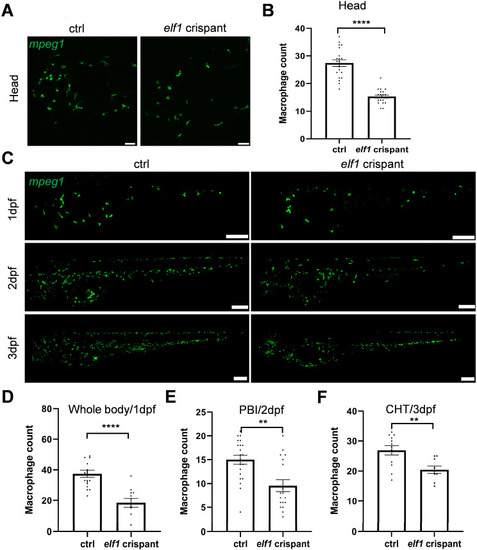
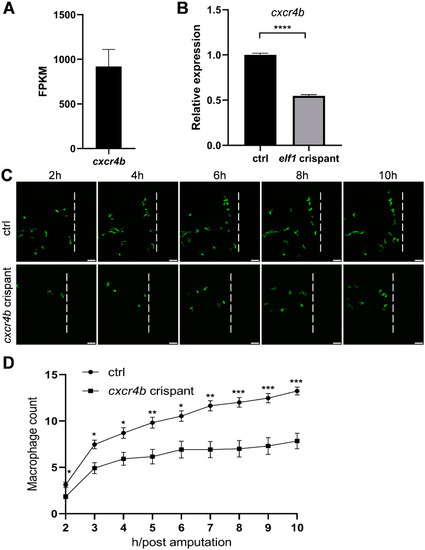
Reduction in macrophages in |
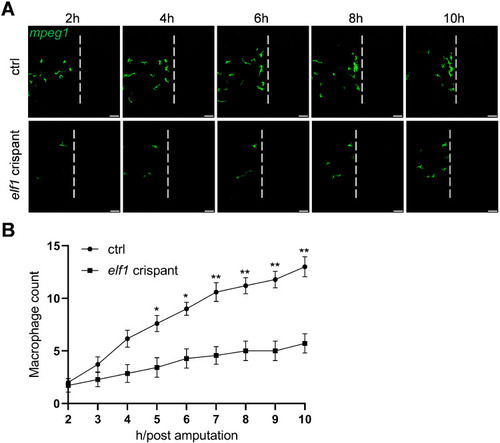
Macrophage behavior following tail amputation in |

Overexpression of a dominant-negative form of Elf1 (DN-Elf1) in macrophages disrupts their response to injury. ( |
Macrophage behavior following tail amputation in |
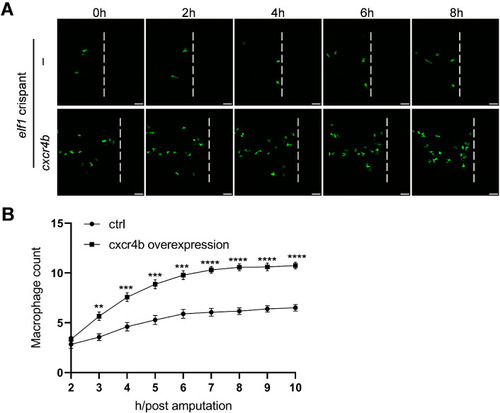
Ectopic expression of |