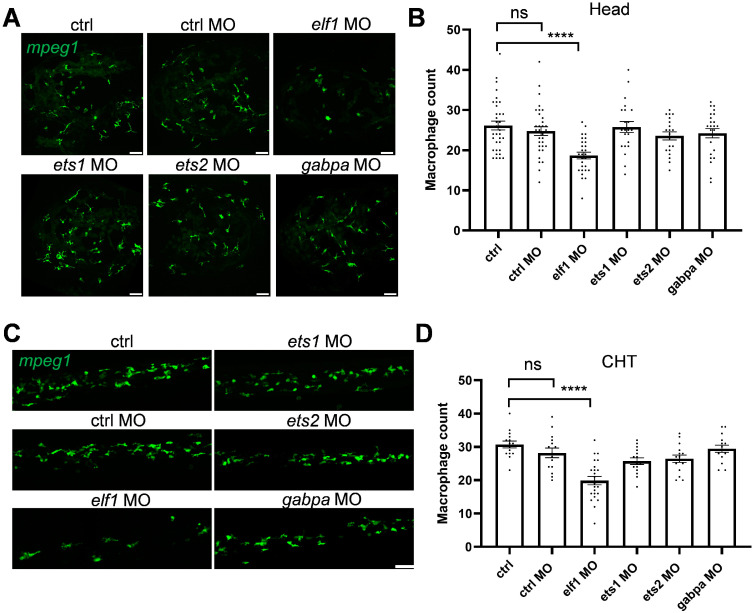
Morpholino knockdown-mediated screening of Ets family members in zebrafish macrophage development. (A) Representative confocal images showing macrophages in the head region of Tg(mpeg1:eGFP) zebrafish larvae at 3 dpf following morpholino-mediated knockdown of Ets family members. (B) Quantification of macrophage numbers in the head regions of the transgenic zebrafish shown in (A). Data were analyzed using one-way ANOVA followed by Dunnett’s test, with n ≥ 20, and shown as mean ± S.E.M. (C) Representative confocal images showing macrophages in caudal hematopoietic tissue (CHT) at 3 dpf following morpholino-mediated knockdown of Ets family members. (D) Quantification of macrophage numbers in the CHT of the transgenic zebrafish shown in (C). Data were analyzed using one-way ANOVA followed by Dunnett’s test, with n ≥ 15, and shown as mean ± S.E.M. Statistical significance is indicated as ns (p ≥ 0.05), **** p < 0.0001. Scale bar: 50 μm.
Acknowledgments
This image is the copyrighted work of the attributed author or publisher, and
ZFIN has permission only to display this image to its users.
Additional permissions should be obtained from the applicable author or publisher of the image.
Full text @ Int. J. Mol. Sci.
Your Input Welcome
Thank you for submitting comments. Your input has been emailed to ZFIN curators who may contact you if
additional information is required.
Oops. Something went wrong. Please try again later.