IMAGE

Figure 5

ID
ZDB-IMAGE-250329-62
Source
Figures for Tan et al., 2025
Image
Figure Caption

Figure 5

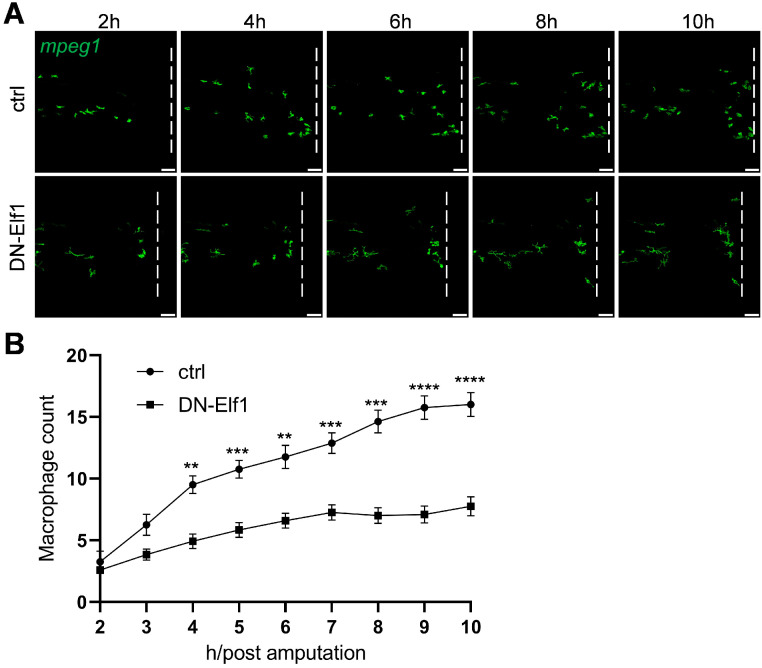
Overexpression of a dominant-negative form of Elf1 (DN-Elf1) in macrophages disrupts their response to injury. (A) Time-lapse imaging of macrophage infiltration at 3 dpf in control zebrafish and zebrafish expressing DN-Elf1 specifically in macrophages. The background transgenic line used was Tg(mpeg1:Gal4FF/UAS:eGFPcaax). Imaging of the caudal fin region was initiated two hours post-amputation. The white dashed line marks the position of transection. Scale bar: 50 μm. (B) Quantification of macrophage numbers within the damage shown in (B). Data were analyzed using two-way ANOVA followed by Sidak’s tests, with n ≥ 7, and shown as mean ± S.E.M. Statistical significance indicated as ** p < 0.01, *** p < 0.001, and **** p < 0.0001.

Acknowledgments
This image is the copyrighted work of the attributed author or publisher, and ZFIN has permission only to display this image to its users. Additional permissions should be obtained from the applicable author or publisher of the image. Full text @ Int. J. Mol. Sci.