IMAGE

Figure 6

ID
ZDB-IMAGE-250329-63
Source
Figures for Tan et al., 2025
Image
Figure Caption

Figure 6

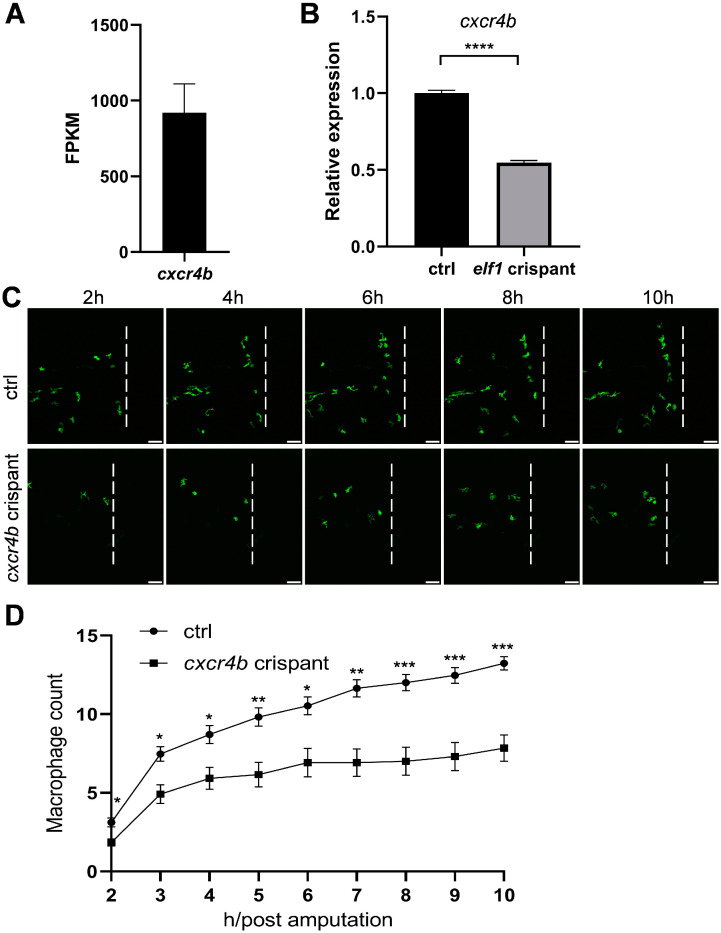
Macrophage behavior following tail amputation in cxcr4b crispants. (A) Expression levels of cxcr4b in zebrafish macrophages, as determined via RNA-seq. Bar plots represent the mean ± S.E.M. (B) Relative expression of cxcr4b in macrophages of elf1 crispants compared to the control group at 3 dpf. Unpaired, two-tailed Student’s t-test results for n = 4 are shown as mean ± S.E.M. Statistical significance indicated as **** p < 0.0001. (C) Time-lapse images showing macrophage infiltration in controls and cxcr4b crispants at 3 dpf. Imaging of the caudal fin region was initiated two hours post-amputation. The white dashed line marks the position of transection. Scale bar: 50 μm. (D) Quantification of macrophage numbers within the damage regions shown in (C). Data were analyzed using two-way ANOVA followed by Sidak’s tests, with n ≥ 10, and shown as mean ± S.E.M. Statistical significance indicated as * p < 0.05, ** p < 0.01, and *** p < 0.001.

Acknowledgments
This image is the copyrighted work of the attributed author or publisher, and ZFIN has permission only to display this image to its users. Additional permissions should be obtained from the applicable author or publisher of the image. Full text @ Int. J. Mol. Sci.