IMAGE

Figure 3

ID
ZDB-IMAGE-250329-60
Source
Figures for Tan et al., 2025
Image
Figure Caption

Figure 3

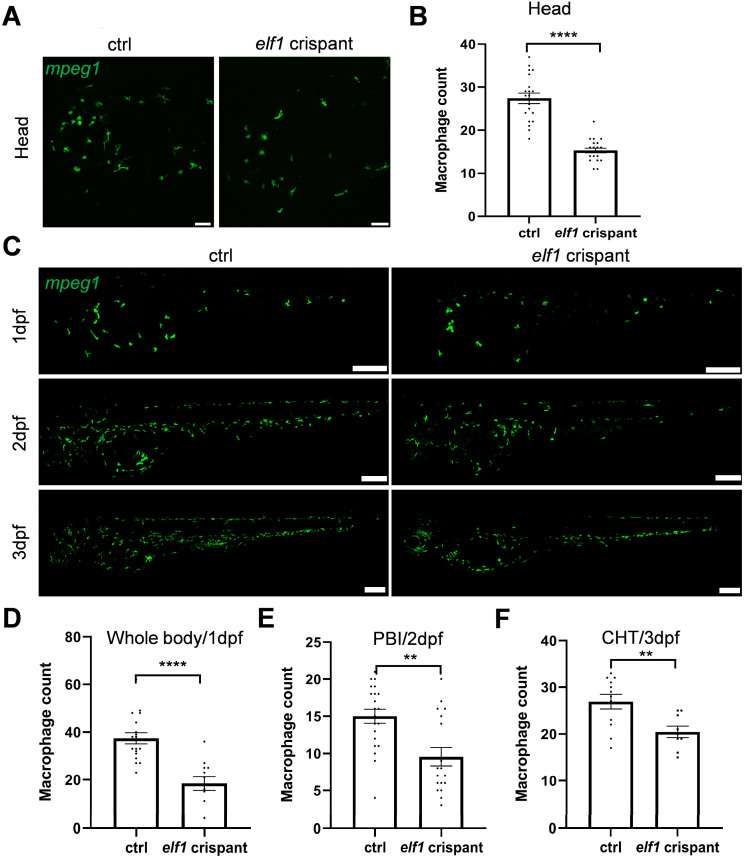
Reduction in macrophages in elf1 crispants. (A) Representative confocal images showing macrophages in the head region in transgenic zebrafish at 3 dpf following CRISPR-mediated mosaic mutants. Scale bar: 50 μm. (B) Quantification of macrophage numbers within the brain regions of the transgenic zebrafish shown in (A). Unpaired, two-tailed Student’s t-test, with n ≥ 20, and results are shown as mean ± S.E.M. (C) Representative confocal images of macrophages in whole zebrafish larvae at 1, 2, and 3 dpf. Scale bar: 200 μm; imaging depth approximately 200 μm. (DF) Quantification of macrophage numbers within specific regions of the transgenic zebrafish shown in (C), including the posterior blood island (PBI) and caudal hematopoietic tissue (CHT). Unpaired, two-tailed Student’s t-test for n ≥ 12, 18, and 9, respectively; results are shown as mean ± S.E.M. Statistical significance indicated as ** p < 0.01 and **** p < 0.0001.

Acknowledgments
This image is the copyrighted work of the attributed author or publisher, and ZFIN has permission only to display this image to its users. Additional permissions should be obtained from the applicable author or publisher of the image. Full text @ Int. J. Mol. Sci.