FIGURE SUMMARY
Title

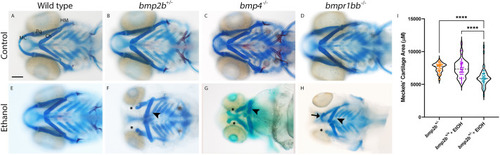
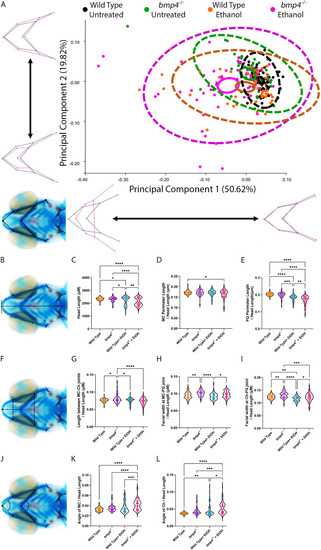
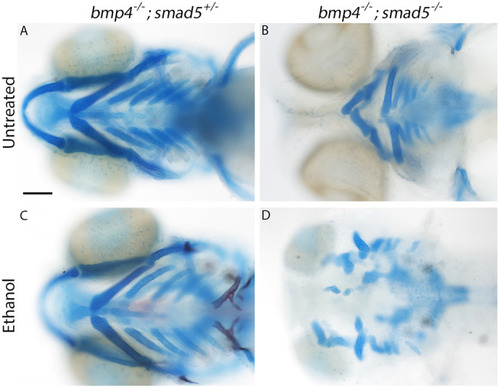
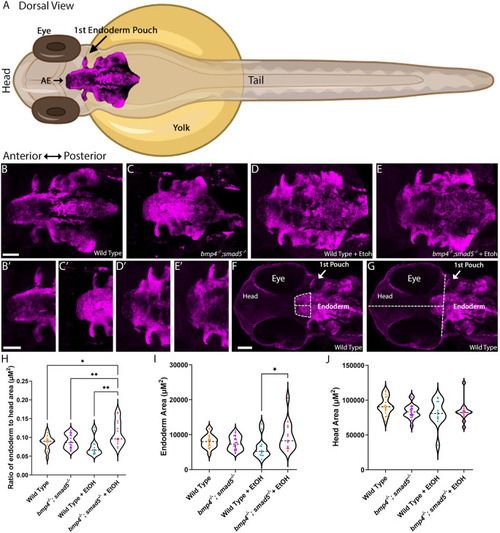
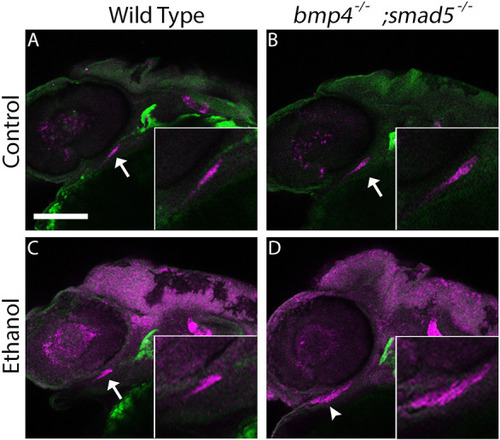
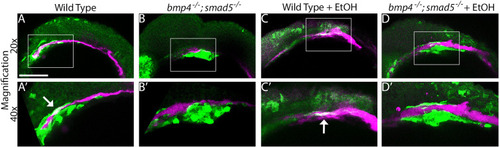
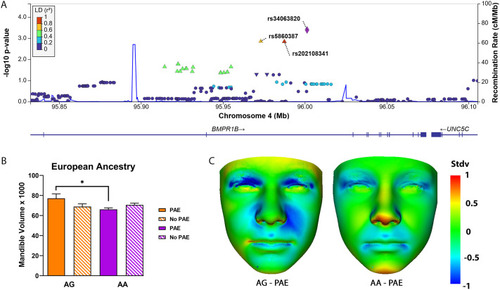
Mutations in the Bone Morphogenetic Protein signaling pathway sensitize zebrafish and humans to ethanol-induced jaw malformations

Authors
Klem, J.R., Schwantes-An, T.H., Abreu, M., Suttie, M., Gray, R., Vo, H., Conley, G., Foroud, T.M., Wetherill, L., CIFASD, Lovely, C.B.
Source
Full text @ Dis. Model. Mech.

Multiple members of the Bmp pathway display ethanol-sensitive facial phenotypes. (A-H) Whole-mount images showing the viscerocranium of zebrafish larvae at 5 dpf that had been exposed to ethanol (Ethanol) or not (Control). Cartilage is shown in blue, bone in red. Views are ventral, with anterior to the left. Scale bar: 100 μm. MC, Meckel's cartilage; Pq, palatoquadrate cartilage; Ch, ceratohyal cartilage; HM, hyomandibular cartilage. bmp2b+/− or bmp4−/− or bmpr1bb−/− larvae develop comparable to wild-type larvae (A-D). Exposure to 1% ethanol at 10-18 hpf results in a range of defects to the viscerocranium, from loss of MC at the extreme end of this range (asterisks) to reductions in size and changes in shape in the MC (arrow) as well as a flattening of the Ch (arrowheads) (E-H). The average ethanol-induced defects are seen in Bmp mutant alleles but not their wild-type siblings. (I) Violin plot showing area measures of Meckel's cartilage. The size of Meckel's cartilage elements is reduced in ethanol-treated bmp2b+/− larvae compared to ethanol-treated wild-type or untreated bmp2b+/− larvae, with F=36.85, ****P=0.0001, one-way ANOVA, n=29 larvae, both Meckel's cartilage elements per group (n=58 in total).

Ethanol exposure alters viscerocranial shape in bmp4−/− zebrafish larvae. (A,B,F) Whole-mount images of the viscerocranium in 5 dpf larvae showing landmarks, linear measures and cartilage angles. Cartilage is shown in blue, bone in red. Views are ventral, with anterior to the left. (A) Landmarks were placed on several joints between the cartilage elements of the viscerocranium. Genotypes are color-coded, with black indicating untreated wild-type larvae (n=61), green indicating untreated bmp4−/− larvae (n=54), orange indicating ethanol-treated wild-type larvae (n=58) and magenta indicating ethanol-treated bmp4−/− larvae (n=66). Areas surrounded by dashed lines represent 95% confidence ellipses comprising all individual data points for each group, areas surrounded by solid lines represent 95% confidence ellipses comprising the mean data points for each group. Wireframe graphs represent the variation as specified at each axis, with black representing no variation and magenta representing variation relative to the black wireframe. For example, principal component (PC)1 captures a shortening and widening in viscerocranial shape, while PC2 represents variation in midfacial width. Procrustes ANOVA showed significant a change in the viscerocranial shape (F=10.37, d.f.=36, P=0.0001). (C) Violin plot of overall head length. Subsequent measurements are all plotted as ratio to overall head length. (D) Meckel's cartilage (MC) perimeter to head length. (E) Palatoquadrate (PQ) cartilage perimeter to head length. (G) Length between midline MC-ceratohyal cartilage (Ch) joints to head length. (H) Facial width at MC-PQ cartilage joints to head length. (I) Facial width at Ch-PQ cartilage joints to head length. (K) MC angle joint to head length. (L) CH angle joint to head length. Linear measures show a significant decrease in facial width and length, and an increase in the angle between cartilage elements, which is represented as flattening of the facial skeleton even when head length is taken into account. *P<0.05; **P<0.01; ***P<0.001; ****P<0.0001 (for individual graph statistics see Table S3).

bmp4−/−;smad5−/− zebrafish larvae exhibit fully penetrant, exacerbated ethanol-induced facial malformations. (A-D) Whole-mount images showing the viscerocranium of zebrafish larvae at 5 dpf that had been exposed to ethanol (Ethanol) or not (Untreated). Cartilage is shown in blue, bone in red. Views are ventral, with the anterior to the left. Scale bar: 100 μm. (A) No impact on facial formation was observed in untreated bmp4−/−;smad5+/− larvae (A). Stereotypical smad5 mutant phenotypes were observed in untreated bmp4−/−;smad5−/− larvae (B). Ethanol does not impact viscerocranial morphology in bmp4−/−;smad5+/− larvae (C), but malformations in ethanol-exposed bmp4−/−;smad5−/− larvae (D) are fully penetrant and ethanol sensitive, resulting in several viscerocranial malformations, thereby recapitulating the severe phenotypes observed in dorsomorphin-treated embryos (Lovely et al., 2016).

Ethanol exposure alters area of the anterior pharyngeal endoderm in bmp4−/−;smad5−/− zebrafish embryos. (A) Schematic of a zebrafish embryo with annotation of the pharyngeal endoderm. AE, anterior endoderm. The zebrafish image was generated using BioRender Created in BioRender by Lovely, B., 2025. https://BioRender.com/20hca0u. This figure was sublicensed under CC-BY 4.0 terms. (B-E) Whole-mount images of the pharyngeal endoderm in zebrafish embryos at 36 hpf. (B′-E′) Magnified views of the anterior pharyngeal endoderm from panels B-E, respectively. Imaged were untreated wild-type embryos, n=18 (B,B′); untreated bmp4−/−;smad5−/− embryos, n=20 (C,C′); ethanol-treated wild-type embryos, n=12 (D,D′); and ethanol-treated bmp4−/−;smad5−/− embryos, n=14 (E,E′). Views are dorsal, with the anterior to the left. (F,G) Whole-mount images of untreated wild-type zebrafish heads taken at 36 hpf, showing the area and length of the anterior pharyngeal endoderm measured from the first pouch to the anterior-most tip. The width of the anterior pharyngeal endoderm was measured at the level of the first pouch (F). The head area was calculated from the length of the head (first pouch to most-anterior tip of the head) and the width of the head (measured at level of the first pouch) (G). All scale bars: 50 μm. (H) Violin plots showing the ratio of the anterior pharyngeal endoderm to the head area (H), the endoderm area (I) or the head area (J). Ethanol-treated bmp4−/−;smad5−/− embryos show increased area of the anterior endoderm compared to all other groups (H). This increased size is not due to changes in head size (I) but directly due to increased size of the anterior pharyngeal endoderm (J). Individual graph statistics are provided in Table S4.

Ethanol exposure changes shape of oral ectoderm expression domain in bmp4−/−;smad5−/− zebrafish embryos. (A-D) Whole-mount confocal images of untreated (top panels) or ethanol-treated (bottom panels) wild-type (left) or bmp4;smad5;sox17:EGFP (right) zebrafish embryos fluorescence labeled for fgf8a (magenta) gene expression at 36 hpf. Views are lateral, with anterior to the left. Scale bar: 100 μm. The endoderm is labeled with GFP (green). Arrows in A-C indicate normal expression of fgf8a in the oral ectoderm of untreated wild-type and bmp4−/−;smad5−/− embryo as well as ethanol-treated wild-type embryos. Arrowhead in D indicates that the domain of fgf8a expression in ethanol-treated bmp4−/−;smad5−/− embryos is expanded anteriorly (n=7 embryos per group). Panel insets are magnified (10×) views of the indicated fgf8a expression domains.

Endoderm-specific Bmp signaling responses are lost in bmp4−/−;smad5−/− embryos but not in ethanol-treated zebrafish embryos. (A-D′) Whole-mount, confocal images of bmp4;smad5;sox17:EGFP;BRE:mKO2 wild-type or bmp4−/−;smad5−/− embryos at 36 hpf that had been ethanol treated (+EtOH) (C-D′) or not (A-B′). Ectoderms were fluorescence labeled for GFP (false-colored magenta) and for active Bmp signaling with mKO2 (false-colored green). Views are lateral, with anterior to the left. Boxed areas within A-D are shown magnified (40×) in A′-D′, respectively. Scale bar: 100 μm. Arrows in A′ and C′ indicate overlap of Bmp signaling response and sox17-labeled endoderm in wild-type embryos. Compared with wild-type embryos (A,A′,C,C′), the endoderm-specific Bmp signaling response is lost in bmp4−/−;smad5−/− embryos (B,B′,D,D′). Ethanol exposure does not alter the Bmp response (C-D′). Embryos per group: wild type (n=5); bmp4−/−;smad5−/− (n=4); wild type + EtOH, n=4; bmp4−/−;smad5−/− (n=8).

Association of jaw deformations with single nucleotide polymorphisms (SNPs) located within BMPR1B in the European ‘look-up’ resource. (A) The y-axis denotes the −log10 (P-value) for the genotype×PAE effect for association with mandible volume (triangles). Indicated on the x-axis is the physical position on the chromosome (Mb). The extent of linkage disequilibrium (LD) (as measured by r2) in the 1000 Genomes European reference panel between each SNP (triangles) and the purple diamond SNP is indicated by the color scale at the top left. Larger values of r2 indicate a greater LD. rs34063820, the SNP with the highest P-value (P=4×10⁻⁴) in BMPR1B, is indicated by a purple diamond. Two SNPs in LD with rs34063820 are also associated with mandible volume, i.e. rs202108341, P=8×10⁻³ (red triangle) and rs5860387, P=8×10⁻³ (yellow triangle). (B) Mandible volume in children of European ancestry (EA) with or without prenatal alcohol exposure (PAE and No PAE, respectively) according to genotype. In individuals with AA genotype, the mandible volume was significantly decreased (*P=0.032) in PAE vs No PAE individuals with the AG genotype. (C) Dense surface model (DSM) analysis of facial signature heatmaps, indicating surface to normal displacement at ±1 standard deviation (Stdv) for mean No PAE age-matched individuals of EA, where red-blue-green coloring indicates a reduction-expansion or agreement compared to the normalized group. Left: AG genotype with PAE (n=10). Right: AA genotype with PAE (n=83), both normalized against all EA age-matched individuals (AG+AA genotype) without PAE (n=35). Red coloring on the mandible tip indicates a mandibular retraction or micrognathia.

Acknowledgments
This image is the copyrighted work of the attributed author or publisher, and ZFIN has permission only to display this image to its users. Additional permissions should be obtained from the applicable author or publisher of the image. Full text @ Dis. Model. Mech.