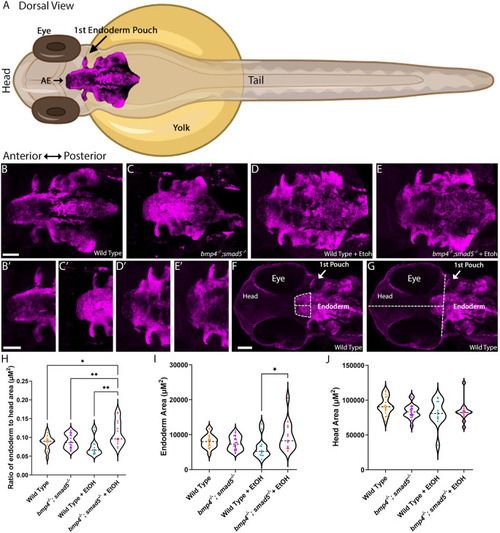
Ethanol exposure alters area of the anterior pharyngeal endoderm in bmp4−/−;smad5−/− zebrafish embryos. (A) Schematic of a zebrafish embryo with annotation of the pharyngeal endoderm. AE, anterior endoderm. The zebrafish image was generated using BioRender Created in BioRender by Lovely, B., 2025. https://BioRender.com/20hca0u. This figure was sublicensed under CC-BY 4.0 terms. (B-E) Whole-mount images of the pharyngeal endoderm in zebrafish embryos at 36 hpf. (B′-E′) Magnified views of the anterior pharyngeal endoderm from panels B-E, respectively. Imaged were untreated wild-type embryos, n=18 (B,B′); untreated bmp4−/−;smad5−/− embryos, n=20 (C,C′); ethanol-treated wild-type embryos, n=12 (D,D′); and ethanol-treated bmp4−/−;smad5−/− embryos, n=14 (E,E′). Views are dorsal, with the anterior to the left. (F,G) Whole-mount images of untreated wild-type zebrafish heads taken at 36 hpf, showing the area and length of the anterior pharyngeal endoderm measured from the first pouch to the anterior-most tip. The width of the anterior pharyngeal endoderm was measured at the level of the first pouch (F). The head area was calculated from the length of the head (first pouch to most-anterior tip of the head) and the width of the head (measured at level of the first pouch) (G). All scale bars: 50 μm. (H) Violin plots showing the ratio of the anterior pharyngeal endoderm to the head area (H), the endoderm area (I) or the head area (J). Ethanol-treated bmp4−/−;smad5−/− embryos show increased area of the anterior endoderm compared to all other groups (H). This increased size is not due to changes in head size (I) but directly due to increased size of the anterior pharyngeal endoderm (J). Individual graph statistics are provided in Table S4.
|
