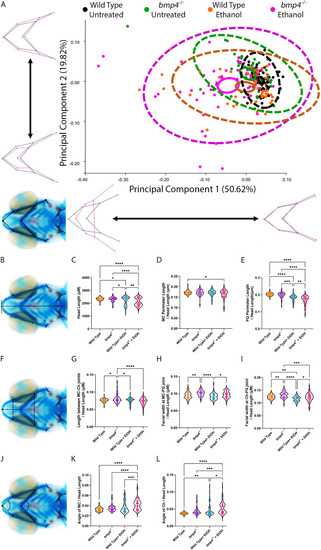
Ethanol exposure alters viscerocranial shape in bmp4−/− zebrafish larvae. (A,B,F) Whole-mount images of the viscerocranium in 5 dpf larvae showing landmarks, linear measures and cartilage angles. Cartilage is shown in blue, bone in red. Views are ventral, with anterior to the left. (A) Landmarks were placed on several joints between the cartilage elements of the viscerocranium. Genotypes are color-coded, with black indicating untreated wild-type larvae (n=61), green indicating untreated bmp4−/− larvae (n=54), orange indicating ethanol-treated wild-type larvae (n=58) and magenta indicating ethanol-treated bmp4−/− larvae (n=66). Areas surrounded by dashed lines represent 95% confidence ellipses comprising all individual data points for each group, areas surrounded by solid lines represent 95% confidence ellipses comprising the mean data points for each group. Wireframe graphs represent the variation as specified at each axis, with black representing no variation and magenta representing variation relative to the black wireframe. For example, principal component (PC)1 captures a shortening and widening in viscerocranial shape, while PC2 represents variation in midfacial width. Procrustes ANOVA showed significant a change in the viscerocranial shape (F=10.37, d.f.=36, P=0.0001). (C) Violin plot of overall head length. Subsequent measurements are all plotted as ratio to overall head length. (D) Meckel's cartilage (MC) perimeter to head length. (E) Palatoquadrate (PQ) cartilage perimeter to head length. (G) Length between midline MC-ceratohyal cartilage (Ch) joints to head length. (H) Facial width at MC-PQ cartilage joints to head length. (I) Facial width at Ch-PQ cartilage joints to head length. (K) MC angle joint to head length. (L) CH angle joint to head length. Linear measures show a significant decrease in facial width and length, and an increase in the angle between cartilage elements, which is represented as flattening of the facial skeleton even when head length is taken into account. *P<0.05; **P<0.01; ***P<0.001; ****P<0.0001 (for individual graph statistics see Table S3).
|
