FIGURE SUMMARY
Title

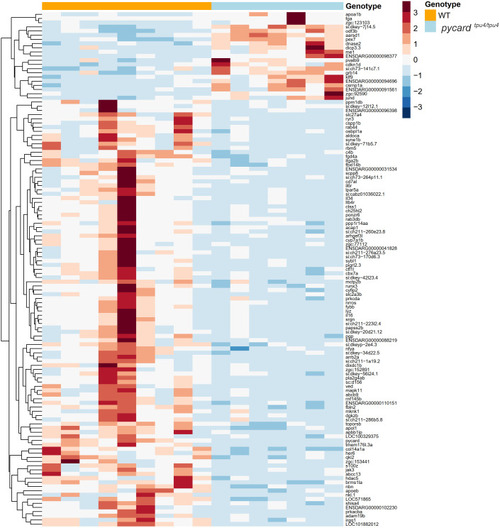
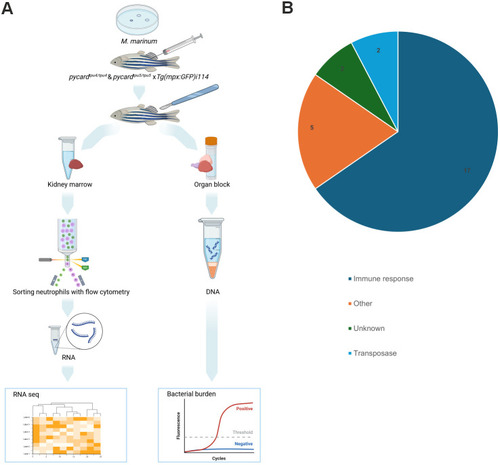
The inflammasome adaptor pycard is essential for immunity against Mycobacterium marinum infection in adult zebrafish

Authors
Uusi-Mäkelä, M., Harjula, S.E., Junno, M., Sillanpää, A., Nätkin, R., Niskanen, M.T., Saralahti, A.K., Nykter, M., Rämet, M.
Source
Full text @ Dis. Model. Mech.

pycard deficiency does not affect the survival or bacterial burden in mycobacterial infection in zebrafish larvae. Embryos were infected with a low dose of M. marinum at the two- to eight-cell stage, and their survival was followed for 7 days. (A) F2 generation results for the mutant line pycardtpu5 [average dose, 48 colony-forming units (CFU); range, 17-79 CFU]. End-point survival proportions: pycard+/+, 16.7%; pycard+/tpu5, 17.1%; pycardtpu5/tpu5, 5.0%. hpi, hours post infection. (B) F2 generation results for the mutant line pycardtpu4 (average dose, 48 CFU, range 17-79 CFU). End-point survival proportions: pycard+/+, 9.7%; pycard+/tpu4, 11.9%; pycardtpu4/tpu4, 8.7%). (C) Pooled results of three repeats for the experiment with the F3 generation of pycardtpu4 (average dose, 24 CFU; range, 2-52 CFU). End-point survival proportions: pycard+/+, 5.8%; pycardtpu4/tpu4, 12.4%. The average dose was measured from an infection solution plated on 7H10 agar plates. The survival data are presented as a Kaplan–Meier survival curve. Statistical analysis was performed with the log-rank test. (D) Embryos originating from pycard+/tpu4 F4 parents were injected with a low dose of M. marinum (average dose, 94 CFU; range, 56-136 CFU) at the two- to 1000-cell stage. Infected larvae were euthanized at 4 days post infection (dpi), and DNA was extracted from the whole larvae. Larvae were genotyped, and bacterial copy number was quantified using quantitative PCR (qPCR) and M. marinum-specific primers. (E,F) Larvae originating from pycard+/tpu4 (E) and pycard+/tpu5 (F) F6 parents were infected with M. marinum (for pycard+/tpu4, average dose, 248 CFU; range, 213-283 CFU; for pycard+/tpu5, average dose, 174 CFU; range, 136-213 CFU) at 2 dpf into blood circulation valley. At 5 dpi, larvae were euthanized, and bacterial copy number was quantified as described in D. Red symbols indicate larvae, which were euthanized according to humane end-point criteria (3 dpi, n=1 pycard+/tpu5 and pycard+/+; 4 dpi, n=1 pycard+/tpu4, pycard+/tpu5 and pycard+/+; 5 dpi, n=1 pycard+/tpu4) or were dead before the end point (2 dpi, n=1 pycard+/tpu5; 3 dpi, n=1 pycardtpu5/tpu5; 5 dpi, n=1 pycard+/tpu4). Statistical significance was analysed using Kruskal–Wallis test. The line represents the median. ns, not significant.

pycard−/− adult fish display reduced survival and a higher bacterial burden upon mycobacterial infection. (A) Adult fish of the pycardtpu5 line were infected with a low dose of M. marinum, and their survival was followed daily. The fish were genotyped post-mortem. Survival data are presented as a Kaplan–Meier survival curve. Statistical analysis was performed with the log-rank test. The data have been pooled from two experiments. Individual experiments, with bacterial doses, are shown in Fig. S2. (B,C) Zebrafish from the mutant line pycardtpu4 (medians: pycard+/+, 10,045 CFU; pycardtpu4/tpu4, 53,426 CFU; **P=0.0033) (B) and the mutant line pycardtpu5 (medians: pycard+/+, 20,349 CFU; pycardtpu5/tpu5, 48,648 CFU; *P=0.023) (C). Fish were infected with a low dose of M. marinum, and the bacterial burden was analysed at 4 weeks post infection (wpi) from whole-organ block DNA using qPCR with M. marinum genome-specific primers. The experiment was performed twice for pycardtpu4 and three times for pycardtpu5. Individual experiments are indicated by different symbols and are shown in separate graphs, with the bacterial dose and the respective statistics in Fig. S3. The line indicates the median. Data were analysed with the Mann–Whitney U-test, two tailed. For statistical purposes, samples in which the bacterial burden was below the detection limit, pycard+/+ fish were designated a value of 100 CFU and pycard−/− fish a value of 0 CFU. Both sexes were included in the experiment in approximately equal numbers.

Unchallenged as well as M. marinum-infected pycardtpu4/tpu4 mutants have normal distribution of blood cell populations. Adult zebrafish were either mock injected (PBS) or infected with a low dose (experiment 1: mean, 17 CFU; range, 12-28 CFU; experiment 2: mean, 19 CFU; range 16-21 CFU) of M. marinum (Mmar). The whole-kidney marrow was analysed at 4 wpi using flow cytometry. Results have been pooled from two experiments (n=3-5 in each group, per experiment). Each datapoint represents an individual fish. The line indicates the median. See Fig. S4 for the individual experiments, including exact sample size, bacterial dose and the gating strategy. Both sexes were included in the experiment in approximately equal numbers.

pycard is expressed in different tissues and blood cell types. (A) Each datapoint represents the expression level of pycard in a single organ collected from a single AB fish (no treatment) [n=3 (gut, kidney, testis, gonad), n=4 (spleen, gills, tailfin, eyes, skin, muscle, brain, swim bladder, heart, liver)]. (B) AB zebrafish infected with M. marinum (Mmar) (mean, 28 CFU; range, 21-34 CFU) display a decrease in pycard expression in their monocyte and granulocyte population. Fish were either infected with Mmar or mock injected with PBS. At 4 wpi, the fish were euthanized and their kidneys were collected for fluorescence-activated cell sorting. RNA was extracted from the sorted populations, and pycard expression was measured with qPCR and normalized to eef1a1/1 expression. Each sample contained kidneys from three fish, pooled (n=3-4). Both male and female fish were used in both experiments. The line indicates the median. *P(monocytes and granulocytes)=0.0286, Mann–Whitney, two tailed.

pycardtpu4/tpu4 fish display an increase in granuloma size. Six wild-type (WT) and four pycardtpu4/tpu4 fish were infected with a low dose (mean, 64 CFU; range, 53-76 CFU) of M. marinum. At 8 wpi, the fish were processed for histological analysis of granulomas with Ziehl–Neelsen stain, Mallory's trichrome stain, hypoxia staining and TUNEL assay. (A) A necrotic and fibrotic granuloma stained with Ziehl–Neelsen stain. Dashed line indicates the area that was considered to belong to the capsule of the granuloma. (B) A necrotic and fibrotic granuloma stained with Mallory's trichrome stain. (C) A nascent granuloma, Ziehl–Neelsen staining. (D) A granuloma containing apoptotic cells, TUNEL assay. (E) A hypoxic granuloma. Scale bars: 50 µm. In B-E, dashed line indicates the borders of the granuloma; arrowheads indicate the positively stained cells. (F) The numbers and characteristics of each granuloma [n=244 (pycard+/+), n=128 (pycardtpu4/tpu4)] were recorded for each fish. Using a linear mixed model, granulomas in pycardtpu4/tpu4 were determined to be larger than those in WT siblings (*P=0.0217) using R-package lme4, with fish as a random and genotype as a fixed factor. The line indicates the median and the interquartile range. Only male fish were used as female fish often present an increased number of small granulomas in the gonads, which complicates analyses. See also Fig. S5 for sizes of individual fish granulomas and Fig. S6 for characterization.

Heatmap of the RNA-seq results in pycardtpu4/tpu4 adult zebrafish mock injected with PBS. Adult zebrafish from the pycardtpu4 mutant line were mock injected and at 4 wpi sacrificed for analysis. Whole-kidney marrow was used for the RNA-seq analysis of male fish [n(WT)=3, n(pycardtpu4/tpu4)=5]. See also Table S1. Expressions are centred and scaled by row. Hierarchical clustering with Euclidean distance and complete linkage method was used to order genes.

Heatmap of the RNA-seq results in adult pycardtpu4/tpu4 zebrafish infected with a low dose of M. marinum. Adult zebrafish from the pycardtpu4 mutant line were infected with a low dose of M. marinum (mean dose, 31 CFU; range, 16-48 CFU), and, at 4 wpi, they were sacrificed for analysis. Whole-kidney marrow was used for RNA-seq analysis in male fish [n(WT)=9, n(pycardtpu4/tpu4)=7]. See also Tables S2 and S3. Expressions are centred and scaled by row. Hierarchical clustering with Euclidean distance and complete linkage method was used to order genes.

Transcriptomic analysis of kidney marrow-derived neutrophils and categorization of differentially expressed genes in adult pycardtpu4/tpu4 and pycardtpu5/tpu5 zebrafish infected with M. marinum. (A) Fish homozygous for pycardtpu4 and pycardtpu5, and WT controls crossed to Tg(mpx:GFP)i114 (AB) were infected with M. marinum [mean dose, 95 CFU; range, 69-118 CFU (pycardtpu4); mean dose, 6 CFU; range, 4-8 CFU (pycardtpu5)]. At 4 wpi, fish were euthanized and dissected to obtain a kidney marrow and a whole-organ block. From a suspended kidney marrow, fluorescent (GFP) neutrophils were sorted with flow cytometry, and RNA was extracted for transcriptomic analysis with RNA-seq [n(WT)=9, (pycardtpu4/tpu4)=3, (pycardtpu5/tpu5)=6]. The experiment was performed once for pycardtpu4 and pycardtpu5 fish. Both sexes were included in the experiment. To monitor the effect of varying bacterial burden on transcriptomics, bacterial copy number was determined with qPCR from DNA extracted from the whole-organ block. Created in BioRender by Junno, M. (2025). https://BioRender.com/d75w516. This figure was sublicensed under CC-BY 4.0 terms. (B) Differentially expressed genes were categorized according to the literature (Table S4).

Acknowledgments
This image is the copyrighted work of the attributed author or publisher, and ZFIN has permission only to display this image to its users. Additional permissions should be obtained from the applicable author or publisher of the image. Full text @ Dis. Model. Mech.