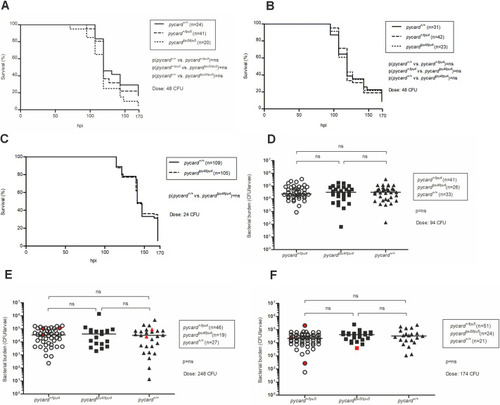
pycard deficiency does not affect the survival or bacterial burden in mycobacterial infection in zebrafish larvae. Embryos were infected with a low dose of M. marinum at the two- to eight-cell stage, and their survival was followed for 7 days. (A) F2 generation results for the mutant line pycardtpu5 [average dose, 48 colony-forming units (CFU); range, 17-79 CFU]. End-point survival proportions: pycard+/+, 16.7%; pycard+/tpu5, 17.1%; pycardtpu5/tpu5, 5.0%. hpi, hours post infection. (B) F2 generation results for the mutant line pycardtpu4 (average dose, 48 CFU, range 17-79 CFU). End-point survival proportions: pycard+/+, 9.7%; pycard+/tpu4, 11.9%; pycardtpu4/tpu4, 8.7%). (C) Pooled results of three repeats for the experiment with the F3 generation of pycardtpu4 (average dose, 24 CFU; range, 2-52 CFU). End-point survival proportions: pycard+/+, 5.8%; pycardtpu4/tpu4, 12.4%. The average dose was measured from an infection solution plated on 7H10 agar plates. The survival data are presented as a Kaplan–Meier survival curve. Statistical analysis was performed with the log-rank test. (D) Embryos originating from pycard+/tpu4 F4 parents were injected with a low dose of M. marinum (average dose, 94 CFU; range, 56-136 CFU) at the two- to 1000-cell stage. Infected larvae were euthanized at 4 days post infection (dpi), and DNA was extracted from the whole larvae. Larvae were genotyped, and bacterial copy number was quantified using quantitative PCR (qPCR) and M. marinum-specific primers. (E,F) Larvae originating from pycard+/tpu4 (E) and pycard+/tpu5 (F) F6 parents were infected with M. marinum (for pycard+/tpu4, average dose, 248 CFU; range, 213-283 CFU; for pycard+/tpu5, average dose, 174 CFU; range, 136-213 CFU) at 2 dpf into blood circulation valley. At 5 dpi, larvae were euthanized, and bacterial copy number was quantified as described in D. Red symbols indicate larvae, which were euthanized according to humane end-point criteria (3 dpi, n=1 pycard+/tpu5 and pycard+/+; 4 dpi, n=1 pycard+/tpu4, pycard+/tpu5 and pycard+/+; 5 dpi, n=1 pycard+/tpu4) or were dead before the end point (2 dpi, n=1 pycard+/tpu5; 3 dpi, n=1 pycardtpu5/tpu5; 5 dpi, n=1 pycard+/tpu4). Statistical significance was analysed using Kruskal–Wallis test. The line represents the median. ns, not significant.
|
