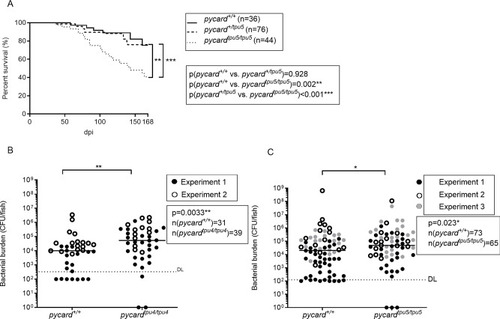
pycard−/− adult fish display reduced survival and a higher bacterial burden upon mycobacterial infection. (A) Adult fish of the pycardtpu5 line were infected with a low dose of M. marinum, and their survival was followed daily. The fish were genotyped post-mortem. Survival data are presented as a Kaplan–Meier survival curve. Statistical analysis was performed with the log-rank test. The data have been pooled from two experiments. Individual experiments, with bacterial doses, are shown in Fig. S2. (B,C) Zebrafish from the mutant line pycardtpu4 (medians: pycard+/+, 10,045 CFU; pycardtpu4/tpu4, 53,426 CFU; **P=0.0033) (B) and the mutant line pycardtpu5 (medians: pycard+/+, 20,349 CFU; pycardtpu5/tpu5, 48,648 CFU; *P=0.023) (C). Fish were infected with a low dose of M. marinum, and the bacterial burden was analysed at 4 weeks post infection (wpi) from whole-organ block DNA using qPCR with M. marinum genome-specific primers. The experiment was performed twice for pycardtpu4 and three times for pycardtpu5. Individual experiments are indicated by different symbols and are shown in separate graphs, with the bacterial dose and the respective statistics in Fig. S3. The line indicates the median. Data were analysed with the Mann–Whitney U-test, two tailed. For statistical purposes, samples in which the bacterial burden was below the detection limit, pycard+/+ fish were designated a value of 100 CFU and pycard−/− fish a value of 0 CFU. Both sexes were included in the experiment in approximately equal numbers.
|
