IMAGE

Fig. 4.

ID
ZDB-IMAGE-250407-95
Genes
Source
Figures for Uusi-Mäkelä et al., 2025
Image
Figure Caption

Fig. 4.

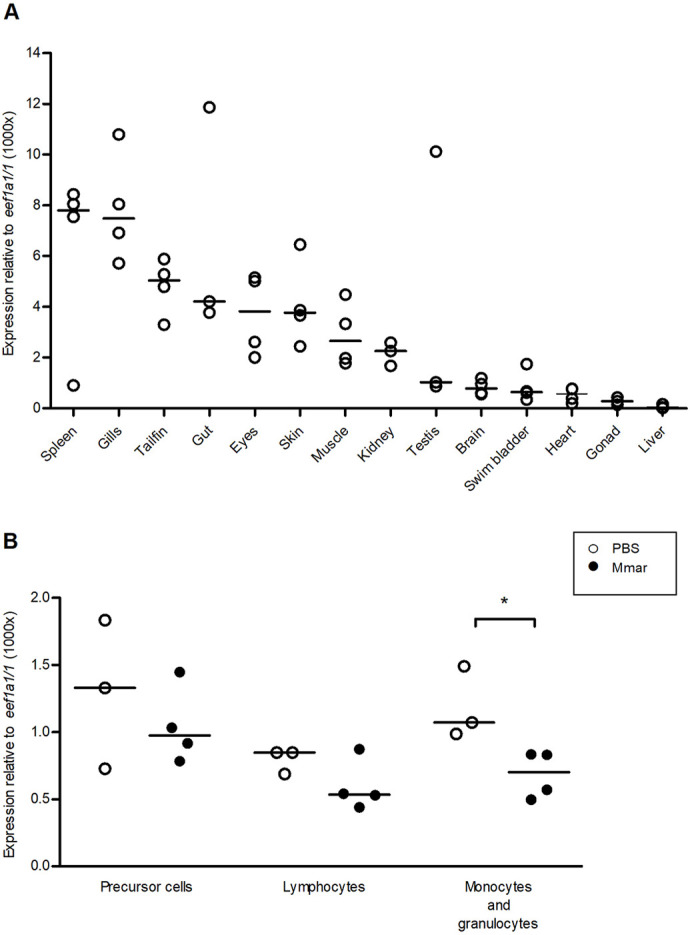
pycard is expressed in different tissues and blood cell types. (A) Each datapoint represents the expression level of pycard in a single organ collected from a single AB fish (no treatment) [n=3 (gut, kidney, testis, gonad), n=4 (spleen, gills, tailfin, eyes, skin, muscle, brain, swim bladder, heart, liver)]. (B) AB zebrafish infected with M. marinum (Mmar) (mean, 28 CFU; range, 21-34 CFU) display a decrease in pycard expression in their monocyte and granulocyte population. Fish were either infected with Mmar or mock injected with PBS. At 4 wpi, the fish were euthanized and their kidneys were collected for fluorescence-activated cell sorting. RNA was extracted from the sorted populations, and pycard expression was measured with qPCR and normalized to eef1a1/1 expression. Each sample contained kidneys from three fish, pooled (n=3-4). Both male and female fish were used in both experiments. The line indicates the median. *P(monocytes and granulocytes)=0.0286, Mann–Whitney, two tailed.

Figure Data
Acknowledgments
This image is the copyrighted work of the attributed author or publisher, and ZFIN has permission only to display this image to its users. Additional permissions should be obtained from the applicable author or publisher of the image. Full text @ Dis. Model. Mech.