
- Title
-
Isotonic medium treatment limits burn wound microbial colonisation and improves tissue repair
- Authors
- Horn, A., Wagner, A.S., Hou, Y., Zajac, J.C., Fister, A.M., Chen, Z., Pashaj, J., Junak, M., Mercado Soto, N.M., Gibson, A., Huttenlocher, A.
- Source
- Full text @ Wound Repair Regen.
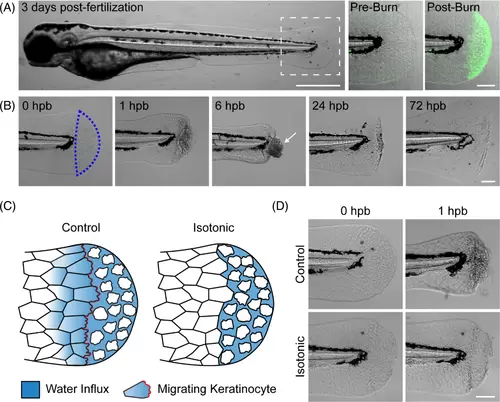
Burn injury generates local epithelial damage in larval zebrafish. (A) Larval zebrafish 3 days post-fertilisation. Dashed box indicates the tailfin region used for burn experiments. Scale bar = 500 μm. At right, representative images show a tailfin pre- and post-burn in the presence of cell impermeable FM dye. Increased dye fluorescence post-burn indicates localised tissue damage. Scale bar = 100 μm. (B) Time series showing a larval zebrafish tailfin at the indicated time, hours post-burn (hpb). Scale bar = 100 μm. (C) Schematic illustrating the effect of isotonic medium on keratinocyte dynamics after burn injury. In control (hypotonic) conditions, net fluid influx into damaged tissue and subsequent swelling of wound-edge keratinocytes stimulate a migratory response. Lack of fluid influx in isotonic conditions prevents keratinocyte swelling and cell migration. (D) Images showing control and isotonic medium treated larvae at the indicated time post-burn. Scale bar = 100 μm. |
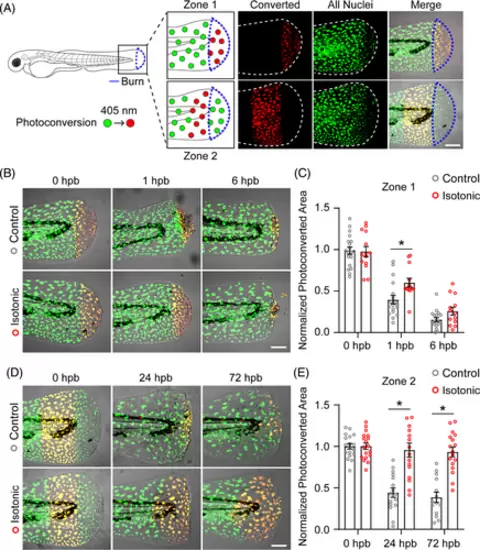
Keratinocyte motility contributes to spread of epithelial damage after burn. (A) Schematic of photoconversion experiment. Keratinocyte nuclei expressing Dendra2 (green) can be photoconverted (red) by exposure to 405-nm light. Photoconversion was performed in the indicated region immediately following burn injury indicated by the blue outline. In merged images, photoconverted nuclei appear yellow due to residual green Dendra2 fluorescence. (B) Images showing control and isotonic medium treated larvae after photoconversion of zone 1 tissue. (C) Quantification of zone 1 photoconverted area at the indicated time, hours post-burn (hpb). Data are normalised to photoconverted area 0 hpb. N ≥ 18 control and N ≥ 13 isotonic treated larvae. (D) Images showing control and isotonic medium treated larvae after photoconversion of zone 2 tissue. (E) Quantification of zone 2 photoconverted area at the indicated time, hours post-burn (hpb). Data are normalised to photoconverted area 0 hpb. N ≥ 14 control and N ≥ 16 isotonic treated larvae. Scale bars = 100 μm. Asterisk indicates p < 0.05 by two-way ANOVA. |
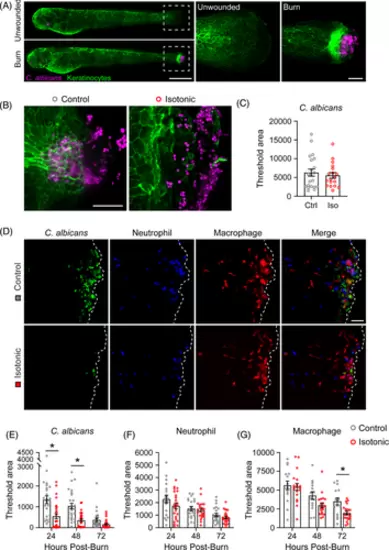
Isotonic medium treatment reduces microbial colonisation of burned tissue. (A) Unwounded or burn wounded Tg(Krt4-UtrCH-GFP) larval zebrafish, labelling epithelial keratinocytes, after 1-h exposure to RFP-tagged C. albicans. Dashed box shows area of inset to the right. Scale bar = 500 μm (whole larvae) and 50 μm (inset). (B) C. albicans colonisation of control and isotonic medium treated tissue 1 hpb. (C) Quantification of C. albicans colonisation 1 hpb. N = 21 control and 18 isotonic treated larvae per condition. (D) mNeon-tagged C. albicans colonisation of Tg(LyzC-BFPxMpeg1.1-mCherry) larvae 24 hpb. Dashed line indicates tailfin boundary. (E–G) Quantification of larvae burned as in D showing C. albicans colonisation (E, N ≥ 26 control and 27 isotonic treated larvae), neutrophil recruitment (F, N ≥ 20 control and 22 isotonic treated larvae) and macrophage recruitment (G, N ≥ 14 control and 19 isotonic treated larvae) over time. Scale bar = 50 μm in B, D. Asterisk indicates p < 0.05 by two-tailed Mann–Whitney test (C) and two-way ANOVA (E–G). |
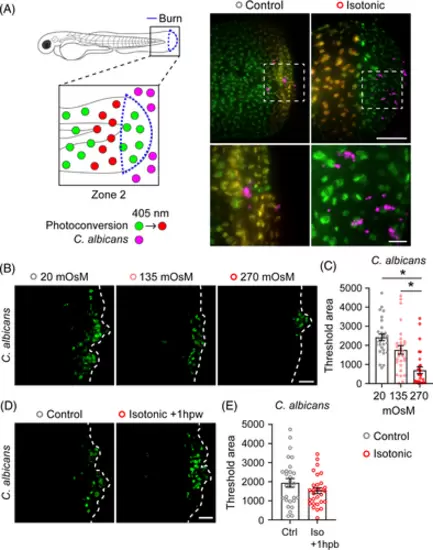
Keratinocyte dynamics enable microbial colonisation of burn wounded tissue. (A) Schematic of photoconversion experiment. Tg(Krt4-H2B-Dendra2) larvae were photoconverted to track zone 2 keratinocytes following exposure to far red-expressing C. albicans. Images show spatial localisation of C. albicans (magenta) relative to zone 2 keratinocytes (yellow) with the indicated treatment 1 hpb. Dashed box indicates region of inset shown below. Scale bar = 100 and 20 μm (inset). (B) C. albicans colonisation of wound area 24 hpb. Larvae were treated with medium supplemented with NaCl to a final concentration of 10 mOsm (Control), 135 mOsm or 270 mOsm (Isotonic). Dashed line indicates tailfin boundary. (C) Quantification of C. albicans colonisation from B. N = 29 larvae for each condition. (D) C. albicans colonisation of wound area 24 hpb. All larvae were burned in control medium, and treatment with isotonic medium began 1 hpb. Dashed line indicates tailfin boundary. (E) Quantification of C. albicans colonisation from D. N = 28 control and 29 isotonic treated larvae. Scale bars = 50 μm unless otherwise indicated. Asterisk indicates p < 0.05 by Kruskal–Wallis test (C) and independent t-test (E). |
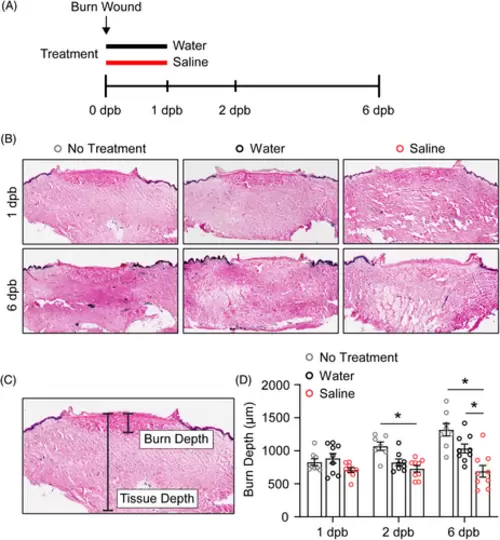
Treatment with topical saline improves burn wound healing potential of cultured human skin. (A) Experimental timeline for burn wounding of cultured human skin. The indicated treatments were applied topically for 1 day post-burn (dpb), and frozen skin sections were taken at each time point indicated. (B) Representative images of frozen skin sections stained with LDH to assess tissue viability. (C) Image showing method of quantification for burn depth. Blinded analysis was performed to measure LDH stained tissue. (D) Quantification of burn depth over time with the indicated treatment. N = 7–9 replicates from 3 subjects. Each subject contained up to 3 technical replicates. Asterisk indicates p < 0.05 by two-way ANOVA. |