
- Title
-
Zebrafish are resilient to the loss of major diacylglycerol acyltransferase enzymes
- Authors
- Wilson, M.H., Hensley, M.R., Shen, M.C., Lu, H.Y., Quinlivan, V.H., Busch-Nentwich, E.M., Rawls, J.F., Farber, S.A.
- Source
- Full text @ J. Biol. Chem.
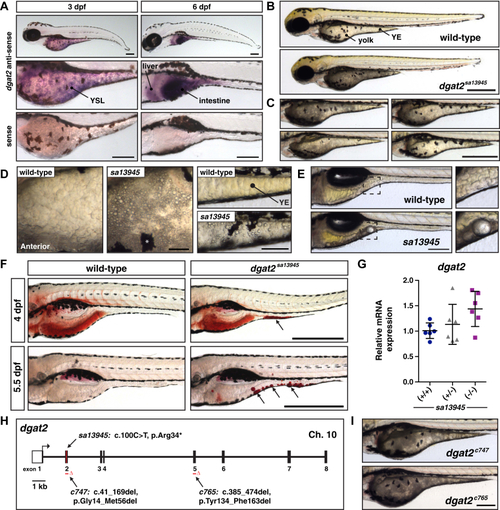
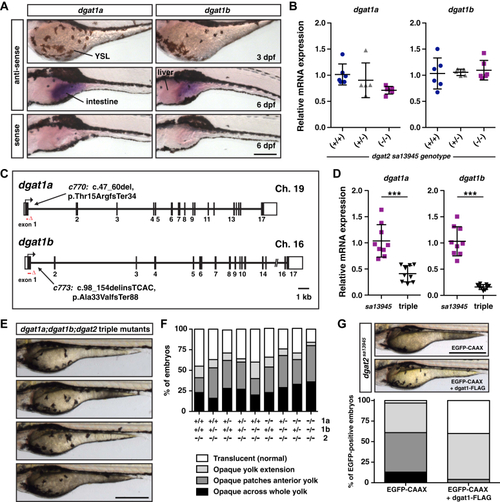
EXPRESSION / LABELING:
PHENOTYPE:
|
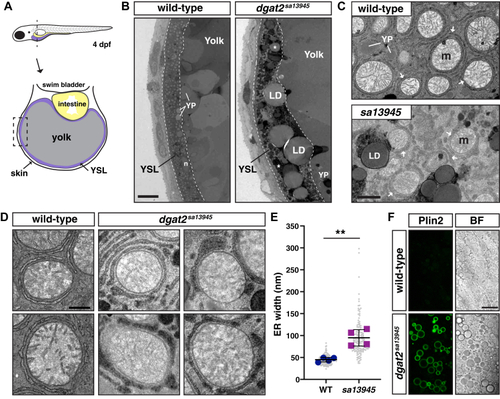
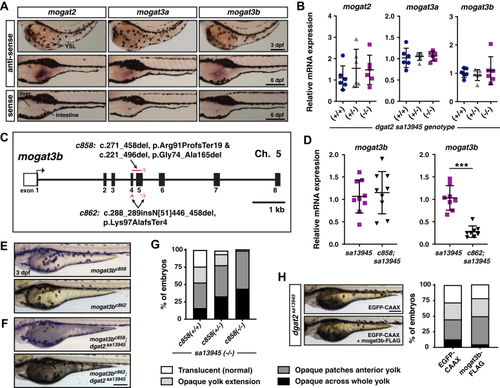
EXPRESSION / LABELING:
PHENOTYPE:
|
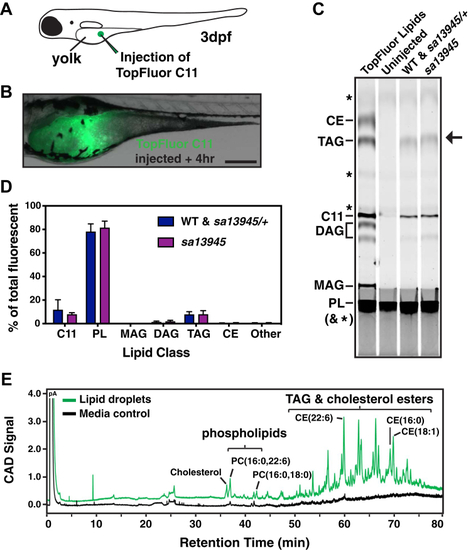
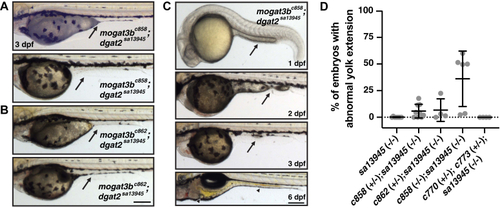
PHENOTYPE:
|
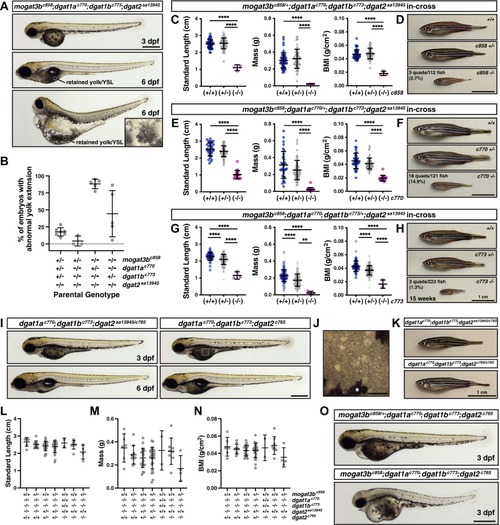
PHENOTYPE:
|
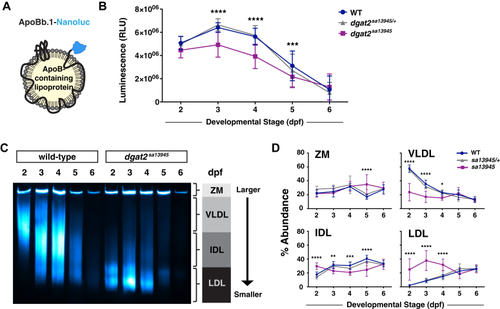
EXPRESSION / LABELING:
PHENOTYPE:
|
EXPRESSION / LABELING:
PHENOTYPE:
|
PHENOTYPE:
|
PHENOTYPE:
|