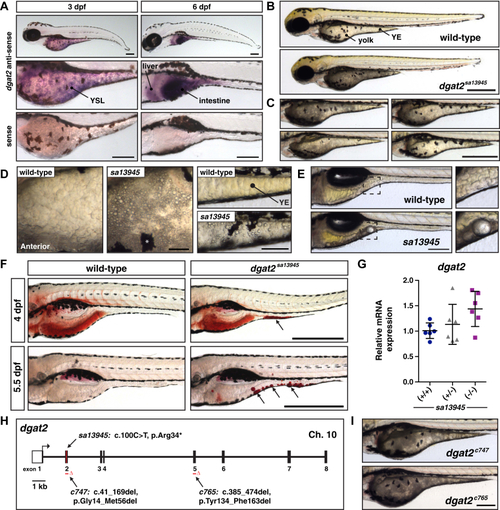
Mutations in dgat2 cause yolk opacity due to aberrant lipid droplet accumulation.A, in situ hybridization for dgat2 expression at 3 and 6 days post fertilization (dpf) in wild-type AB embryos; dgat2 is expressed in the yolk syncytial layer (YSL), liver and intestine; images are representative of all embryos from three experiments at each stage with n = 10 embryos per probe per experiment; Scale bars = 200 μm. B, representative images of a wild-type embryo and a homozygous mutant dgat2sa13945 embryo with a fully opaque yolk at 3 dpf; Scale = 500 μm. C, Examples of the heterogeneity in yolk opacity in dgat2sa13945 mutant embryos at 3 dpf; Scale = 500 μm. D, higher magnification images of the yolk in wild-type and dgat2sa13945 mutant embryos at 3 dpf highlighting visible accumulation of droplets; left: anterior yolk, right: yolk extension (YE), ∗ melanocyte; Scale = 50 μm. E, dgat2sa13945 larvae at 6 dpf sometimes retain yolk and/or large droplets; right shows magnification of noted regions; Scale = 200 μm. F, images of wild-type and dgat2sa13945 mutant embryos stained with Oil Red O to visualize neutral lipid. Arrows point to lipid droplets; images are representative of embryos from three experiments at each stage with n = 8 to 10 embryos per experiment; Scale = 500 μm. G, quantitative RT-PCR for dgat2 expression in wild-type, dgat2sa13945/+, and dgat2sa13945 embryos at 3 dpf (N = 6; 10 pooled fish per sample/genotype, one-way ANOVA, p = 0.0844). H, depiction of the dgat2 gene structure highlighting the nature and locations of the c747 and c765 CRISPR/Cas9 mutations in addition to the sa13945 mutation in dgat2 [GRCz11; ENSDARG00000018846, transcript 201 (ENSDART00000066793.7)], for more detail, see Fig. S2. I, representative images of yolk opacity in homozygous mutant dgat2c747 and dgat2c765 embryos at 3 dpf; scale = 200 μm.
|
