
- Title
-
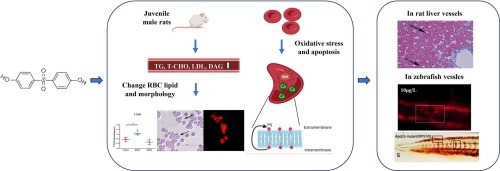
Bisphenol S remodels red blood cell membrane lipids by altering plasma lipid levels, causing the risk of venous thrombosis in SD rats and zebrafish embryos
- Authors
- Li, J., Li, Z., Zhu, Y., Peng, H., Du, Z., Ru, S., Wang, W.
- Source
- Full text @ Environ. Int.
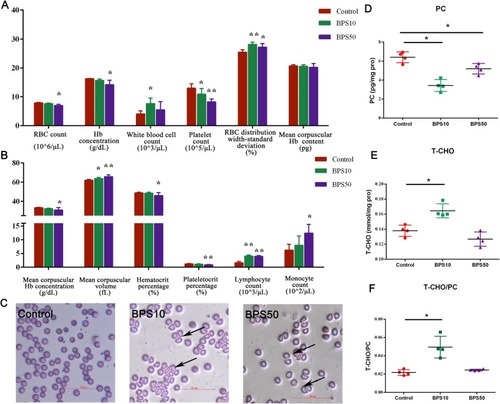
The effect of BPS on RBCs after rats were treated with BPS orally for 32 days. (A) and (B) Routine blood parameters in each group. n = 6. (C) Blood smear stained with Wright Giemsa to observe the morphology of RBCs. Scale bar = 50 μm. The levels of PC (D) and T-CHO (E) in the RBC membrane. n = 4. (F) The ratio of T-CHO to PC of RBC membrane in each group. n = 4. The data are expressed as the means ± SDs; * 0.01 < p < 0.05 and ** p < 0.01 compared with the control. |
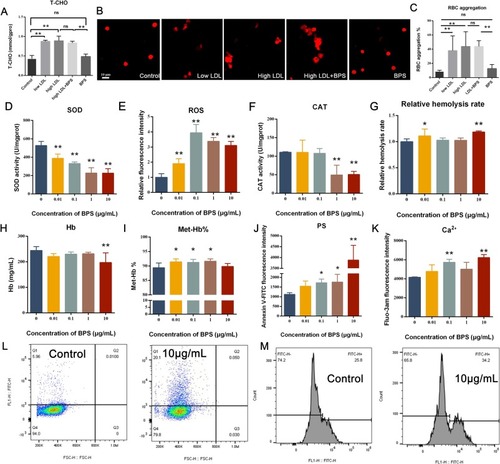
The effect of BPS and LDL exposure on RBCs. The levels of T-CHO (A) in the RBC membrane after RBCs were treated with low-dose LDL (232 μg/mL), high-dose LDL (464 μg/mL), 464 μg/mL LDL combined with 100 μg/L BPS, and 100 μg/L BPS alone for 24 h, n = 3. (B) RBCs were exposed in LDL or BPS for 24 h. The morphology and aggregation of RBC were detected by confocal microscopy and the percentage of aggregation was shown in (C). n = 3. The levels of SOD (D), ROS (E), and CAT (F) in RBCs after BPS exposure for 24 h. n = 3. The relative hemolysis rate compared to the control group (G), the concentration of Hb (H) and the percent of Met-Hb compared with the concentration of Hb (I) were measured. n = 4. BPS induced PS externalization (J) (n = 4) and Ca2+ accumulation (K) (n = 3) after exposure for 24 h. (L) The sample density diagram of Annexin V-FITC fluorescence in control and 10 μg/mL BPS after exposure for 24 h. (M) Representative histogram of Fluo-3 fluorescence of RBCs in the control group and 10 μg/mL BPS group after exposure for 24 h. The data are expressed as the means ± SDs; * 0.01 < p < 0.05 and ** p < 0.01 compared with the control. |
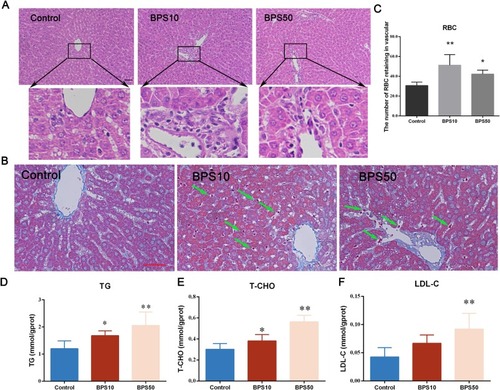
BPS induced RBC retention in the rat liver vasculature. (A) The structure of rat livers shown by H&E staining. Scale bar = 50 μm. (B) Masson staining showed the distribution of the fiber and RBCs in the rat liver. Scale bar = 50 μm. (C) The number of RBCs in the vasculature of the liver was counted according to Masson staining (B). n = 6. (D, E and F) Upregulated lipids, including TG, T-CHO, and LDL-C, were detected. n = 6. The data are expressed as the means ± SDs; * 0.01 < p < 0.05 and ** p < 0.01 compared with the control. |
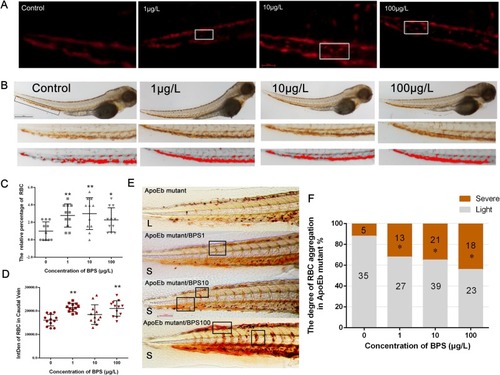
Abnormal adhesion of RBCs in the tail of zebrafish induced by BPS. (A) The screen shots of the videos of RBCs flow in tail blood vessels of zebrafish during 10 s. Scale bar: 50 μm. (B) RBCs were observed by o-diphenylamine staining. Scale bar: 500 μm. (C) The relative percentage of adhered RBCs during 10 s in the caudal vein compared to control group was counted and calculated according to videos. n = 11. (D) The IntDen of RBCs was quantified on the basis of (B). n = 12. (E) O-diphenylamine staining showed the RBC distribution in vessels of ApoEb mutant. Light (L) is defined as few RBC aggregation in the vessels like ApoEb mutant group. Severe (S) is defined as RBCs aggregated in intersegmental vessels/dorsal longitudinal anastomotic vessels/caudal vein like ApoEb mutant/BPS100 group. (F) Percentage of larvae with RBC accumulation degree in vessels was calculated according to (E) (n ≥ 40). The data are expressed as the means ± SDs; * 0.01 < p < 0.05 and ** p < 0.01 compared with the control. Videos. RBCs flow in tail blood vessels of zebrafish during 10 s in all treatment groups. |
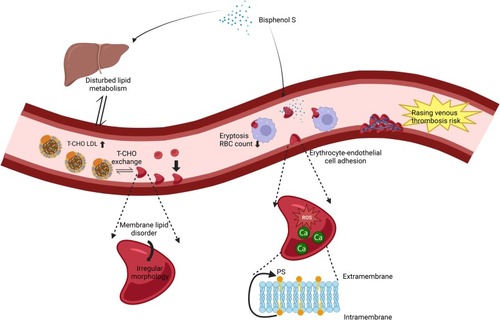
Schematic diagram of the increasing risk of VT induced by BPS through disturbance of RBCs. |
|