
Image
|
Figure Caption
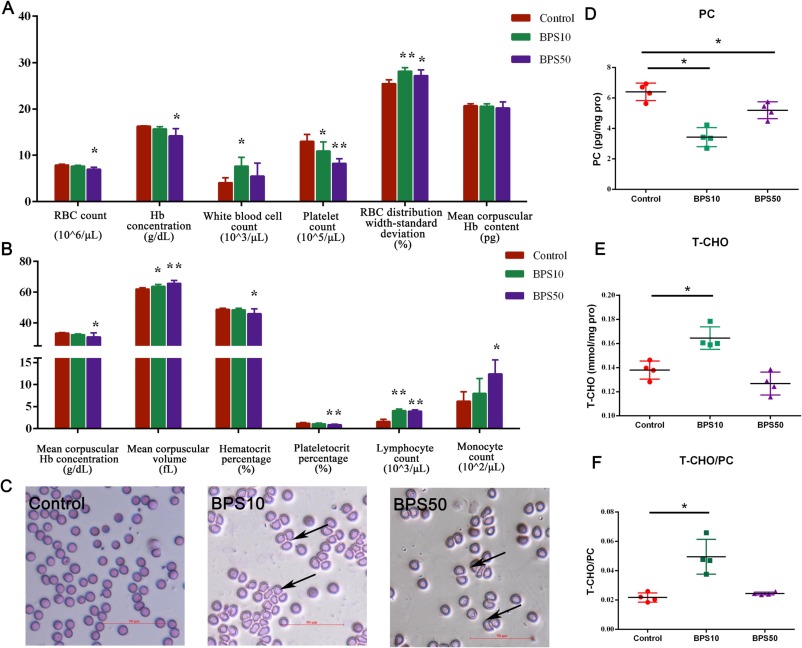
Fig. 1 The effect of BPS on RBCs after rats were treated with BPS orally for 32 days. (A) and (B) Routine blood parameters in each group. n = 6. (C) Blood smear stained with Wright Giemsa to observe the morphology of RBCs. Scale bar = 50 μm. The levels of PC (D) and T-CHO (E) in the RBC membrane. n = 4. (F) The ratio of T-CHO to PC of RBC membrane in each group. n = 4. The data are expressed as the means ± SDs; * 0.01 < p < 0.05 and ** p < 0.01 compared with the control.
Acknowledgments
This image is the copyrighted work of the attributed author or publisher, and
ZFIN has permission only to display this image to its users.
Additional permissions should be obtained from the applicable author or publisher of the image.
Full text @ Environ. Int.