
Image
|
Figure Caption
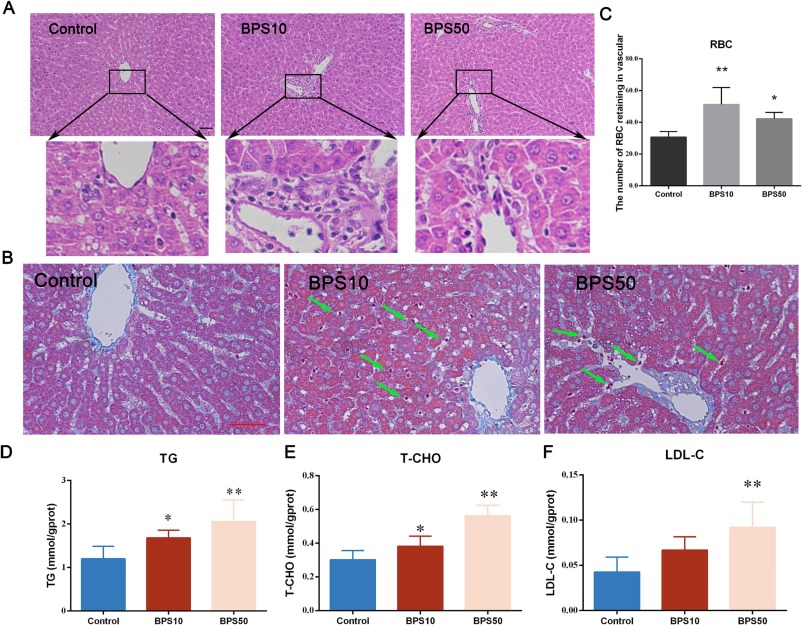
Fig. 3 BPS induced RBC retention in the rat liver vasculature. (A) The structure of rat livers shown by H&E staining. Scale bar = 50 μm. (B) Masson staining showed the distribution of the fiber and RBCs in the rat liver. Scale bar = 50 μm. (C) The number of RBCs in the vasculature of the liver was counted according to Masson staining (B). n = 6. (D, E and F) Upregulated lipids, including TG, T-CHO, and LDL-C, were detected. n = 6. The data are expressed as the means ± SDs; * 0.01 < p < 0.05 and ** p < 0.01 compared with the control.
Acknowledgments
This image is the copyrighted work of the attributed author or publisher, and
ZFIN has permission only to display this image to its users.
Additional permissions should be obtained from the applicable author or publisher of the image.
Full text @ Environ. Int.