
|
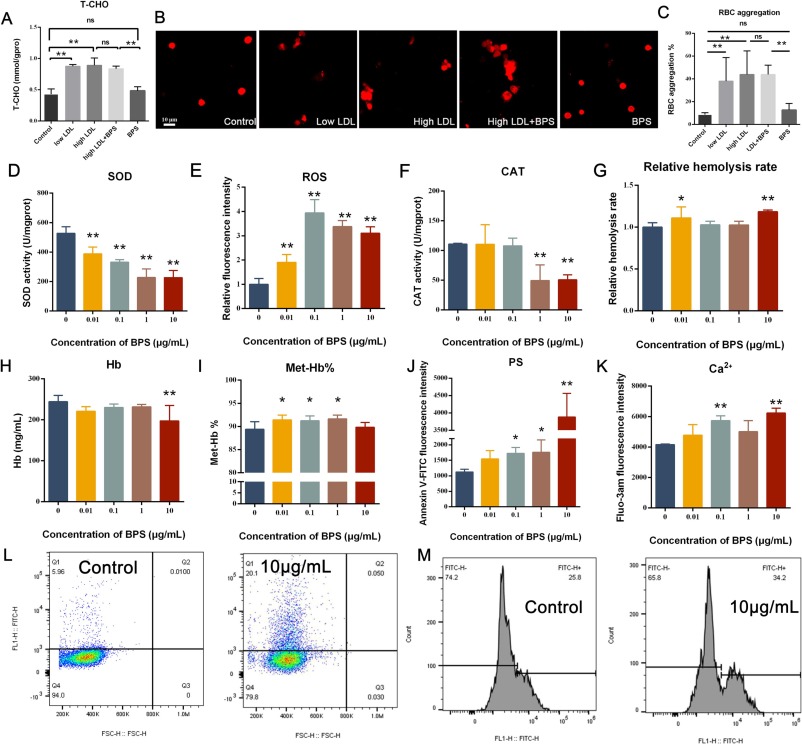
Fig. 2 The effect of BPS and LDL exposure on RBCs. The levels of T-CHO (A) in the RBC membrane after RBCs were treated with low-dose LDL (232 μg/mL), high-dose LDL (464 μg/mL), 464 μg/mL LDL combined with 100 μg/L BPS, and 100 μg/L BPS alone for 24 h, n = 3. (B) RBCs were exposed in LDL or BPS for 24 h. The morphology and aggregation of RBC were detected by confocal microscopy and the percentage of aggregation was shown in (C). n = 3. The levels of SOD (D), ROS (E), and CAT (F) in RBCs after BPS exposure for 24 h. n = 3. The relative hemolysis rate compared to the control group (G), the concentration of Hb (H) and the percent of Met-Hb compared with the concentration of Hb (I) were measured. n = 4. BPS induced PS externalization (J) (n = 4) and Ca2+ accumulation (K) (n = 3) after exposure for 24 h. (L) The sample density diagram of Annexin V-FITC fluorescence in control and 10 μg/mL BPS after exposure for 24 h. (M) Representative histogram of Fluo-3 fluorescence of RBCs in the control group and 10 μg/mL BPS group after exposure for 24 h. The data are expressed as the means ± SDs; * 0.01 < p < 0.05 and ** p < 0.01 compared with the control.